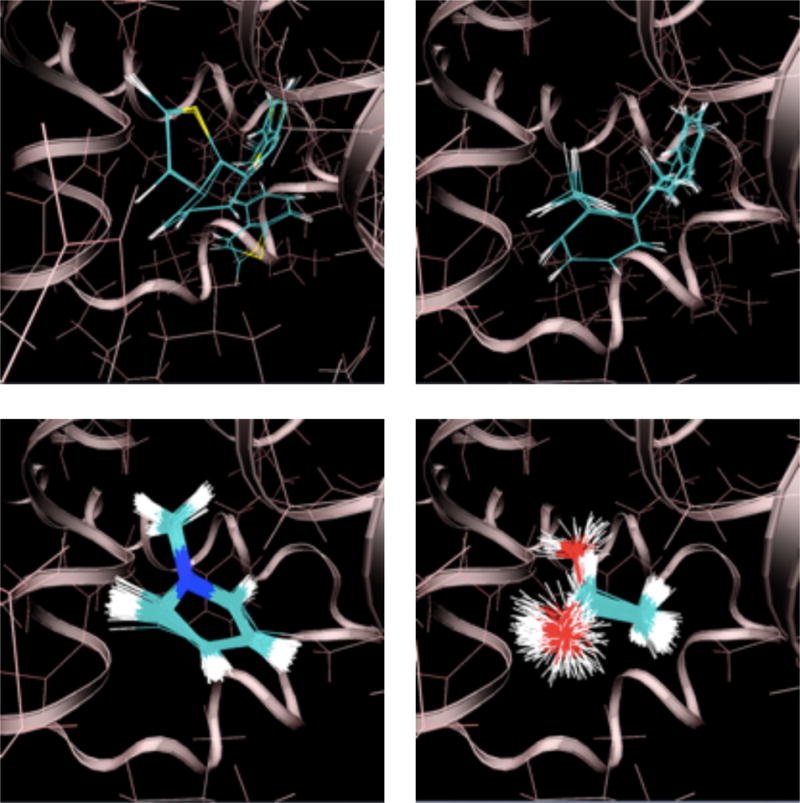
Figure 3.

Ligand configurations sampled at 300 K with a full receptor interaction grid. Clockwise from the upper left: thianaphthene, o-xylene, 1-methylpyrrole, and ethanol. The secondary structure of T4 lysozyme is shown as a ribbon. The protein structure is from an alchemical pathway calculation of p-xylene binding.
