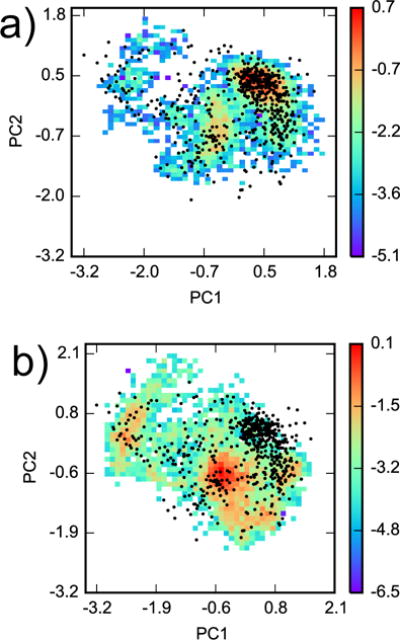
Figure 7.

Configuration space comparison between YANK and AlGDock. Principal components analysis was performed on snapshots from all YANK simulations for heavy atoms within 5 Å of Val 111 in PDB ID 3DMZ. Two-dimensional histograms, weighted by Eq. 5, of YANK snapshots from (a) indole and (b) methanol were projected on the first two principal components. The histograms are plotted on a logarithmic scale. The black dots are projections of the 576 snapshots used in AlGDock calculations onto the same eigenvectors.
