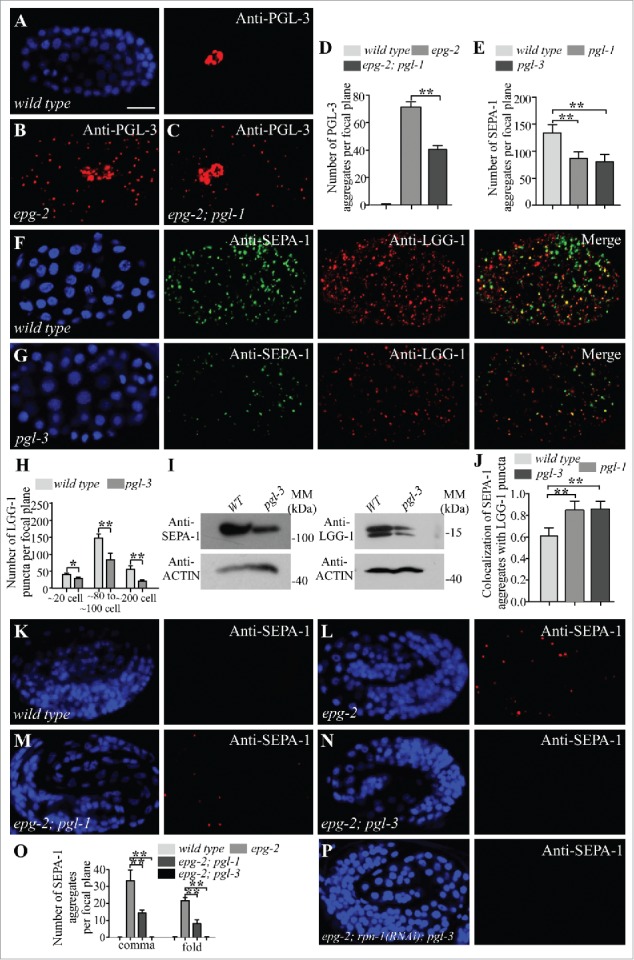
Figure 2.

Depletion of PGL-1 and PGL-3 renders degradation of SEPA-1 independent of EPG-2. (A and B) In wild-type embryos, PGL-3 is not detected in somatic cells (A), but accumulates into a large number of granules in the somatic cells of epg-2 mutant embryos (B). (C) The number of PGL-3 aggregates in somatic cells is lower in epg-2; pgl-1 mutant embryos than epg-2 single mutants. Images were taken of embryos at the same developmental stage and using the same exposure time. (D) The number of PGL-3 aggregates per focal plane in wild-type, epg-2 and epg-2; pgl-1 embryos at the ∼100 cell stage. n = 3 focal planes from 3 embryos, data are shown as mean ± SD, **P < 0.01. (E to G) Compared to wild-type embryos (F), the number of SEPA-1 aggregates, detected by anti-SEPA-1, is decreased in pgl-3 mutants while the colocalization of SEPA-1 aggregates with LGG-1 puncta is increased. Quantification of the number of SEPA-1 aggregates in wild-type, pgl-1 and pgl-3 embryos at the ∼100 cell stage is shown in (E). n = 3 focal planes from 3 embryos, data are shown as mean ± SD, **P < 0.01. (H) The number of LGG-1 puncta per focal plane in wild-type and pgl-3 mutant embryos at the ∼20 cell stage, ∼80 to ∼100 cell stage and ∼200 cell stage. n = 3 focal planes from 3 embryos, data are shown as mean ± SD, *P < 0.05, **P < 0.01. (I) Immunoblotting assays revealed that protein levels of SEPA-1 and LGG-1 are decreased in extracts of pgl-3 mutant embryos compared with those of wild-type embryos. (J) The colocalization of SEPA-1 aggregates with LGG-1 puncta in wild-type, pgl-1 and pgl-3 embryos at the ∼100 cell stage. n = 3 focal planes from 3 embryos, data are shown as mean ± SD, **P < 0.01. (K to N) In wild-type embryos, no SEPA-1 aggregates are detected at the fold stage (K). SEPA-1 aggregates accumulate in epg-2 mutant embryos (L). Compared to epg-2 single mutants, the number of SEPA-1 aggregates is reduced in epg-2; pgl-1 mutant embryos (M) and in epg-2; pgl-3 mutant embryos (N). (O) Quantification of the number of SEPA-1 aggregates per focal plane in wild-type embryos and epg-2, epg-2; pgl-1 and epg-2; pgl-3 mutant embryos at the comma and the fold stage. n = 3 focal planes from 3 embryos, data are shown as mean ± SD, **P < 0.01. (P) Compared to epg-2; pgl-3 mutants, the number of SEPA-1 aggregates is not changed in epg-2; rpn-1(RNAi); pgl-3 mutant embryos. Scale bar: 10 μm (A to C, F, G, K to N, P).
