
Figure 3. Agreement of REI and ODI.
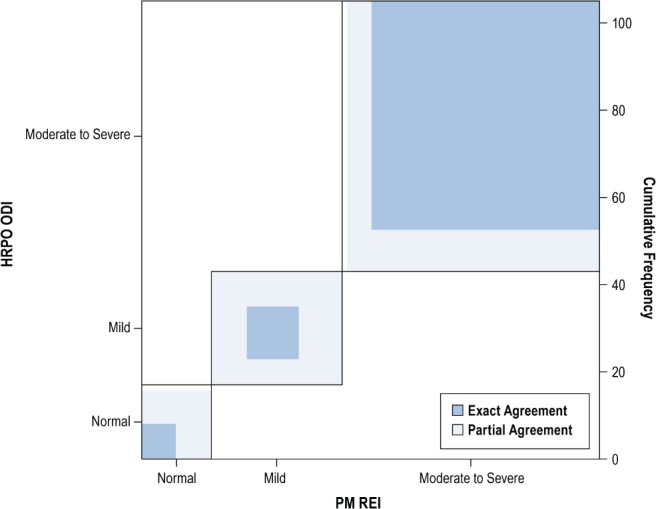
The percentage of patients in each (REI or ODI) category is represented by the length of the box (on the x-axis or y-axis, respectively). The percentage of patients with exact agreement on REI and ODI is represented by the blue shading in each category; the percentage of patients with partial agreement (ie. off by one category) is represented by the light blue shading. REI = respiratory event index, ODI = oxygen desaturation index.