
Figure 7. Blind predictions from CASP 11.
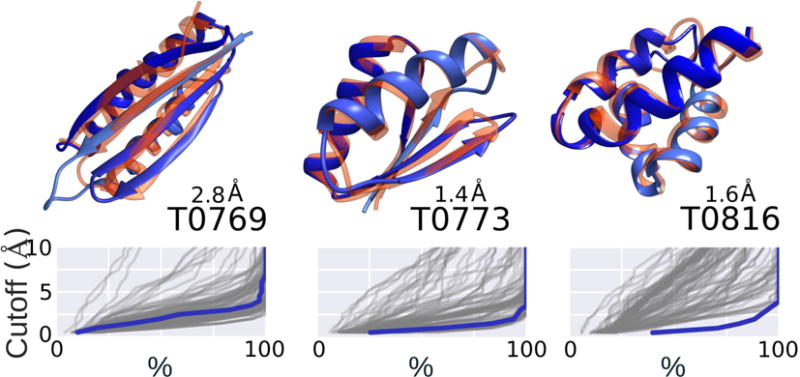
TOP: The name of the targets are denoted according to CASP numbering T0 and can be accessed through http://www.predictioncenter.org. We are the “Laufer” group (number 428). The number on top of the name is the RMSD of our number one submission: centroid structure of the highest population cluster from MELD trajectories. BOTTOM: Hubbard plots115 representing our prediction accuracy (blue) compared to predictions by all other groups in CASP (grey lines). The best results are shown by the shoulder in the line (where the slope changes upwards) being more to the right and low RMSD values (higher % of the structure being less than X Å away from native). Adapted from reference66.