
Figure 8. The CASP blind test of protein structure prediction.
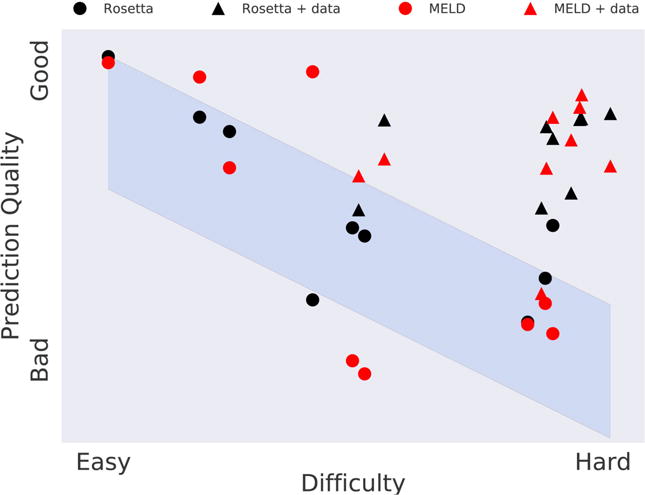
The x-axis represents the degree to which known proteins can be used as starting models for predicting target protein structure. Blue band represents the historical average over 20 years of CASP events, showing that bioinformatics methods have been challenged to predict protein structures. The triangles shows that, when given some additional information beyond the amino-acid sequence, the MELD physical method (black triangles) gives comparable predictions to the best bioinformatics methods (one of which is Rosetta, red triangles).