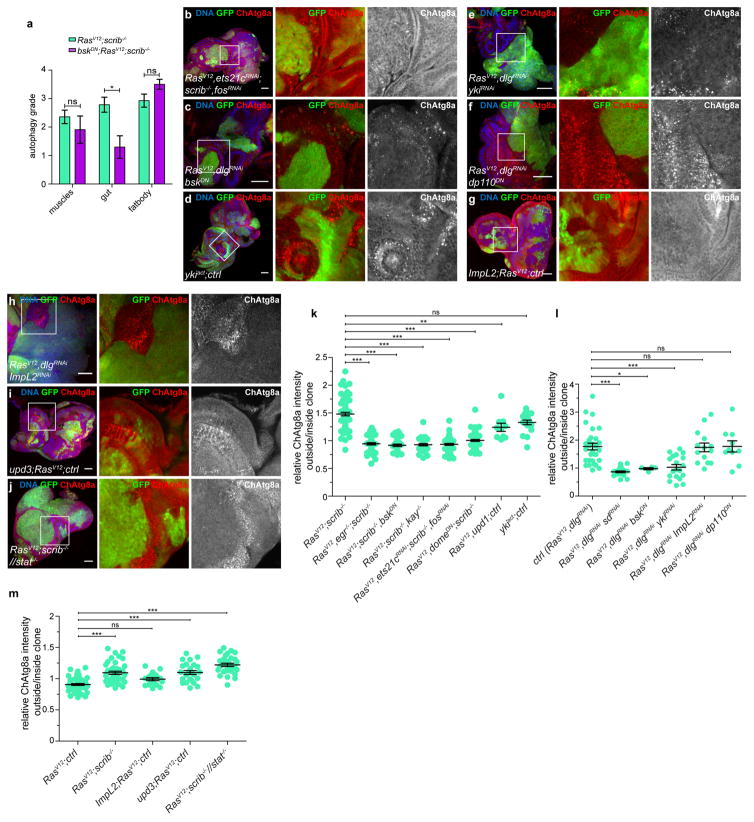
Extended Data Figure 7. NAA responses.
a, Systemic autophagy grading upon tumour intrinsic inhibition of JNK signalling in the EAD. Values depict mean ± s.e.m. of three independent pooled experiments. n = 7 (RasV12scrib−/−) or 11 (>bskDNRasV12scrib−/−) animals. b–k, Representative confocal images, quantified in Extended Data Fig. 8k–m. NAA is downstream of Fos and Ets21c transcription factor activity (b). Expression of bskDN suppresses NAA (c). Clonal overexpression of yki is sufficient to trigger autophagy in neighbouring cells (d). Knockdown of yki suppresses NAA (e). Reduction of tumour growth by disrupted PI3K-I signalling does not affect NAA induction (f). ImpL2 is neither sufficient nor necessary for NAA (g, h). Upd3 cooperates with RasV12 for NAA induction (i).. Removal of JAK/STAT signalling in neighbouring tissue does not suppress NAA (j). Quantification of relative 3 × ChAtg8a-intensities of indicated genotypes (k). Data are mean ± s.e.m. from three independent pooled experiments. n = 38 (RasV12scrib−/−), n = 24 (RasV12egr−/−scrib−/−), 18 (RasV12scrib−/−, >bskDN), n = 17 (RasV12scrib−/−kay−/−), 29 (RasV12ets21cRNAiscrib−/−fosRNAi),n = 34 (RasV12domeDNscrib−/−),n = 5 (RasV12upd+ctrl) or n = 9 (ykiactctrl) discs. l, Relative 3× ChAt8ag intensities of indicated genotypes. Data are mean ± s.e.m. from three independent pooled experiments, n = 15 (RasV12dlgRNAi),n = 11 (RasV12 dlgRNAisdRNAi),n = 2 (RasV12dlgRNAibskDN), n = 10 (RasV12dlgRNAiykiRNAi), n = 7 (RasV12dlgRNAi ImpL2RNAi) or n = 5 (RasV12 dlgRNAi dp110DN) discs. m, Quantification of relative ChAtg8a intensities of indicated genotypes. Data are mean ± s.e.m. of three independent pooled experiments. n = 24 (RasV12ctrl),n = 20 (RasV12scrib−/−), n = 9 (ImpL2+RasV12ctrl), n = 12 (upd3RasV12ctrl) or 15 (RasV12scrib−/−//stat) discs. Scale bars, 50 μm (b–j). *P = 0.0127; ns, not significant by unpaired two-tailed t-test (a). *P ≤ 0.05, **P ≤ 0.01, ***P < 0.0001 by one-way ANOVA with Dunnett’s correction (k–m).

