
Figure 5.
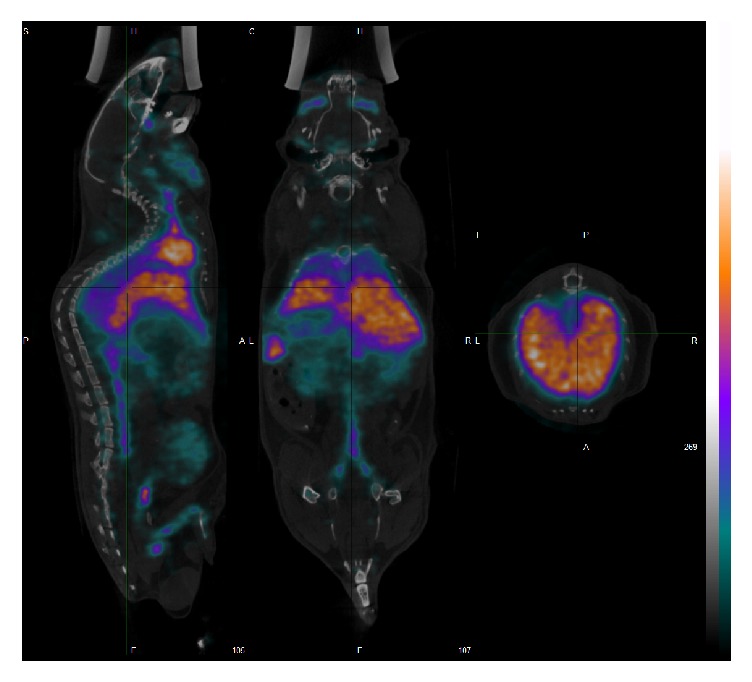
In vivo SPECT/CT images of the 99mTc-labeled liposomes. The 3D reconstructed and coregistered SPECT and CT image are shown together with sagittal, coronal, and axial images (from left to right). Uptake of the liposomes by the liver and spleen is clearly visible in the images.