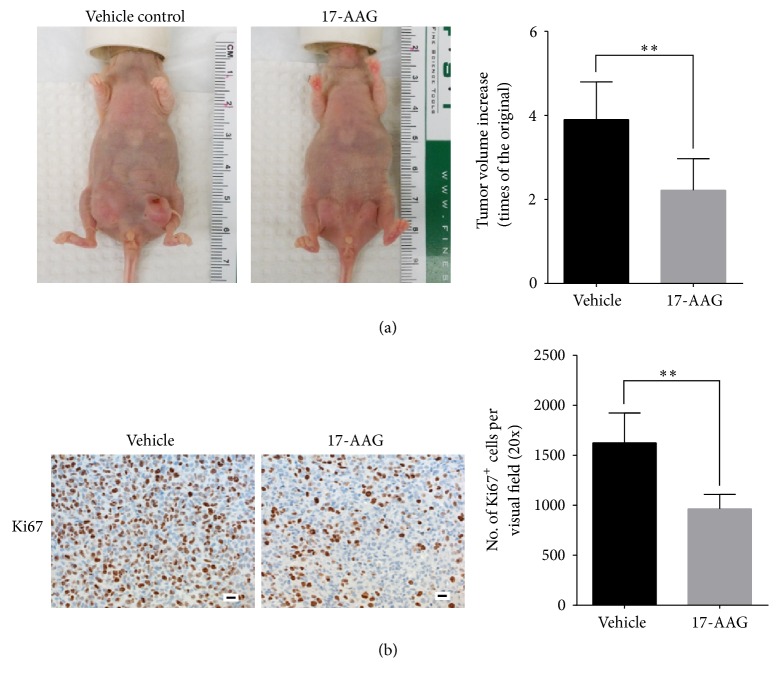
Figure 6.
Antitumor effect of Ki67 staining of 17-AAG. (a) Representative IHC staining of Ki67 of tumor specimens from mice treated with vehicle or 17-AAG (scale bar: 20 µm, n = 3, ∗∗P < 0.01). (b) Tumor growth delay. The data are expressed as mean fold change after 9 days' treatment in tumor volume ± standard deviation compared to tumor volume measured immediately before initiation of treatment (n = 6, ∗∗P < 0.01). Representative photographs of the tumor-bearing mice from the two groups after treatment are shown in the left panel.

