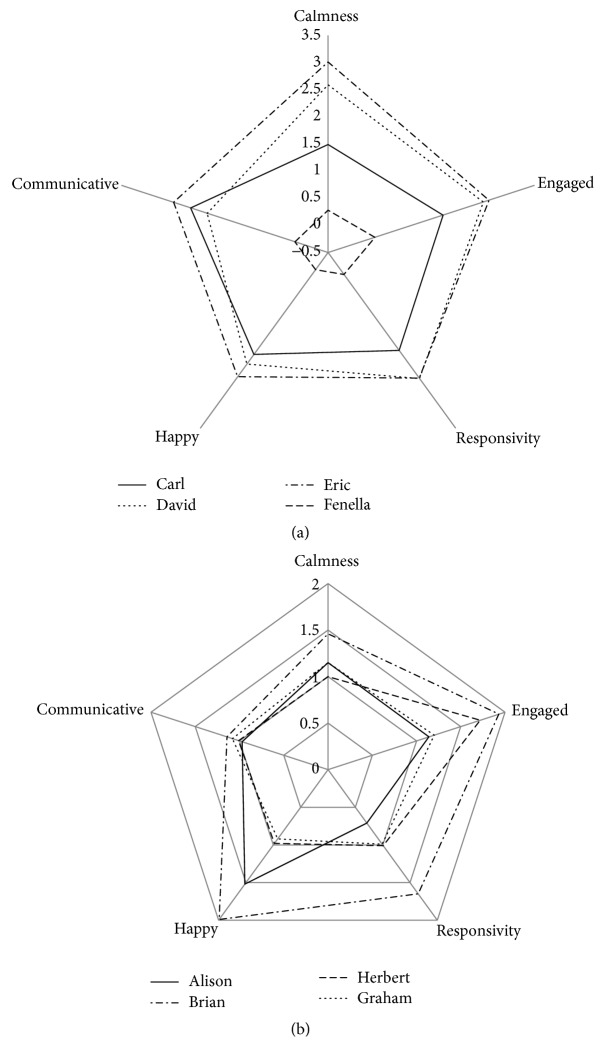
Figure 1.
Radar plot of mean change in five rating scales (happy, communicative, calmness, engaged(-ness), and responsivity) for each of the eight participants. The radar plot shows the 5 ratings for each participant, such that the distance from the centre (at which point the change in rating scale = −0.5, i.e., a deterioration) indicates the magnitude of the changes. If every participant made an equal improvement the shapes would be regular pentagons. Rating scales are designed to display positive values for improved functioning in that domain.

