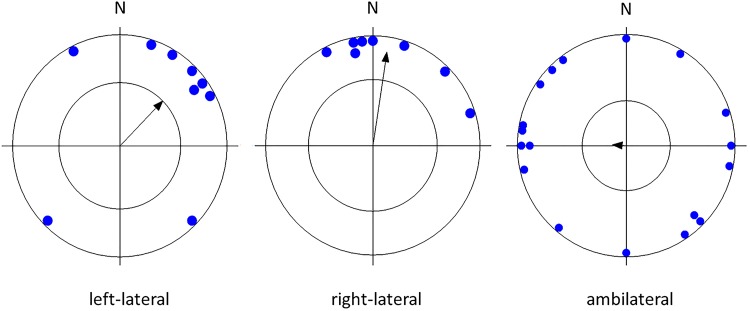
Fig 4. Mean preference for compass direction of a dish with snacks of the first choice.
Angular means over dogs of different lateralization types. The arrow indicates the grand mean axial vector (μ) calculated over all angular means. The length of the mean vector (r) provides a measure of the degree of clustering in the distribution of the mean vectors. The inner circle marks the 0.05 level of significance border of the Rayleigh test. See Table 2 for statistics.

