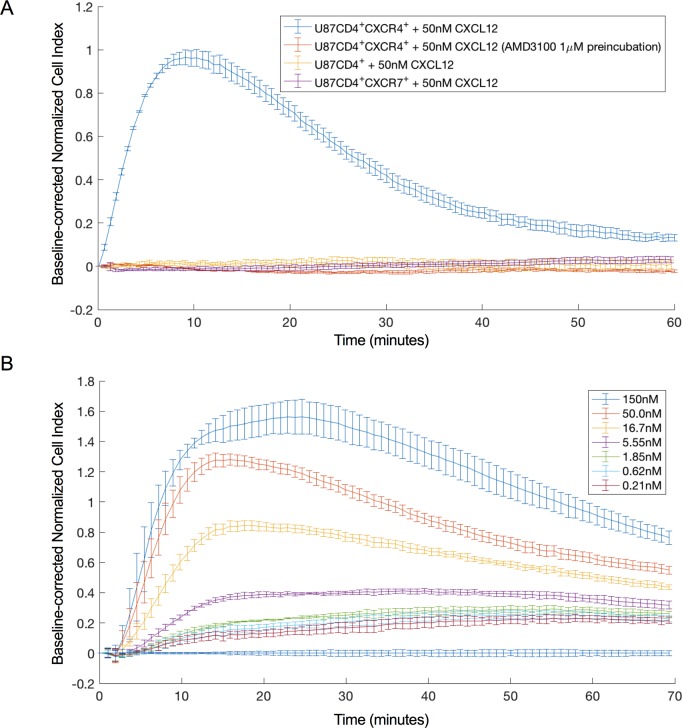
Fig 1. Impedance profile resulting from CXCL12-induced CXCR4 signaling.
(a) CXCL12-induced impedance response on U87.CD4.CXCR4 cells with (orange) and without (blue) one hour pre-incubation with the specific CXCR4 antagonist AMD3100. CXCL12-induced impedance response on U87.CD4 (yellow) and U87.CD4.CXCR7 cells (purple). For each time point the mean CI value and standard deviation of 3 technical repeats within the same experiment are shown. (b) Dose-dependent response on U87.CD4.CXCR4 cells elicited by 0.2 nM—150 nM CXCL12. The figure depicts one out of three independent datasets used to calculate the mean EC50. The mean CI and standard deviation of 6 technical repeats are shown. Normalization and baseline-correction were done as described in the method section. For clarity, one in every 5 data points is plotted.

