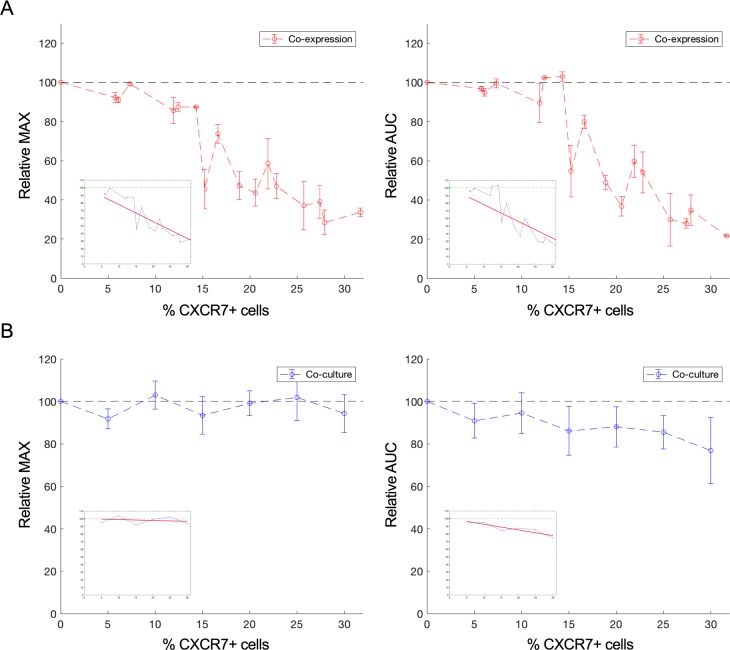
Fig 5. Relative MAX and AUC of the CXCL12 induced CXCR4 response in function of CXCR7 expressing cells.
(a) Co-expression cultures, in which CXCR4 and CXCR7 are co-expressed on the cell surface. Relative MAX response (left) and relative AUC (right) within the first 60 minutes after ligand addition (50 nM CXCL12) relative to the level of CXCR7 co-expression in U87.CD4.CXCR4 cells (red). The response of U87.CD4.CXCR4 cells solely transfected with empty vector plasmid (CXCR7 not present) was set to 100%. Data from six independent experiments (with slightly varying transfection efficiencies) are included in the analysis. Mean and standard deviation were estimated from two technical repeats within each experiment (b) Co-cultures in which CXCR4 and CXCR7 were not co-expressed on the same cell but present on different cell populations. Relative MAX response (left) and relative AUC (right) within the first 60 minutes after ligand addition (50 nM CXCL12) to U87 co-cultures with increasing amount of X4-/X7+ cells (blue). For each ratio of X4+/X7- in co-culture with X4-/X7+ cells, the response of a similar ratio of X4+/X7- cells in co-culture with X4-/X7- cells was set to 100%. The mean and standard deviation were calculated using three independent experiments. Within each experiment, two technical repeats were averaged. Linear least square regression analysis was performed on the relative AUC and MAX values in function of the % CXCR7-positive cells and the best linear fit for the data is shown in each figure.

