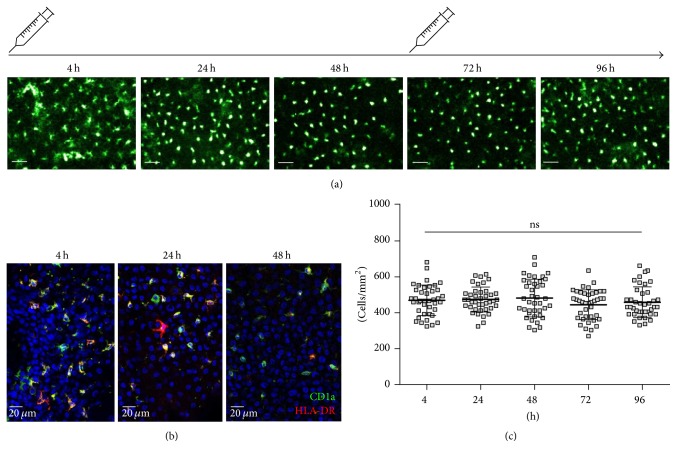
Figure 3.
In vivo imaging and quantification of LCs. (a) Images of HLA-DR-labeled Langerhans cells in macaque epidermis were obtained by in vivo fibered confocal microscopy over 5 days. Scale bars: 50 μm. (b) Immunohistofluorescence on longitudinal sections of epidermis from skin biopsies obtained 4 h, 24 h, or 48 h after injection of HLA-DR and CD1a antibodies. (c) Quantification of the cell number from 20 different frames/animal that were randomly chosen from videos covering an imaging zone of 1 cm in diameter (n = 2). Mean ± SEM, Friedman's test. ns: nonsignificant. Representative images are shown for one from 2 analyzed animals.

