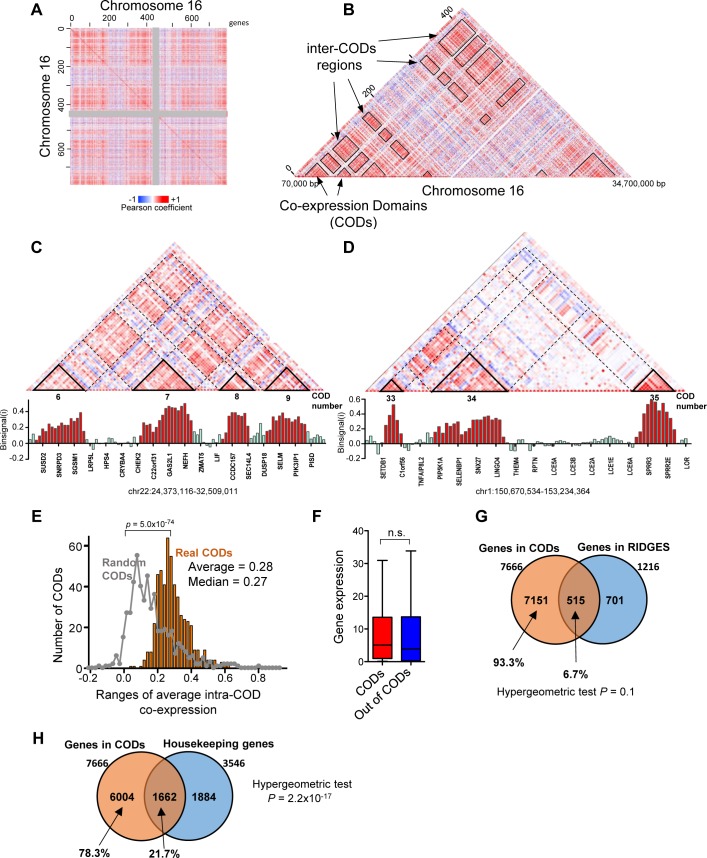
Fig 1. Gene expression is organized into CODs.
(A) Heat map representation of the coexpression matrix of chromosome 16. Each pixel represents the Pearson coefficient of the correlation between expressions of gene i (columns) and gene j (rows) in 100 normal breast tissue samples. Coexpression ranges from –1 (blue) to +1 (red). Genes are arranged in the chromosomal order. The centromeric region is depicted in grey for reference. (B) Detail, seen as triangle, of the heat map shown in (A). Contiguous genes with higher coexpression coefficients between them than with surrounded genes were termed coexpression domains (CODs) and are highlighted in the heat map. Regions of the matrix corresponding to pairs of genes i, j that reside in different CODs (inter-CODs) are also highlighted. (C, D) Upper panel. Detail of regions of the heat maps of coexpression of chromosome 22 and 1. CODs, determined as defined in Methods, are highlighted and numbered according to S1 Table. Lower panel. Histogram of binsignal(i) parameter for each gene i. The name of every fifth gene is displayed. Bars of genes located within CODs are in red. Genomic coordinates of the regions in hg19 are provided. (E) Distribution of average intra-COD coexpression values. Distribution obtained with randomized CODs of the same size is also plotted on the grey line. Distributions are significantly different, with p = 5.0 x 10−74 (Mann-Whitney test). (F) Gene expression (RNA-seq data, RSEM normalized) of genes that are inside or outside of CODs. Differences were not significant (n.s.; Mann-Whitney test). (G) Venn diagram showing overlap between COD genes and RIDGE genes (S2 Table). (H) Venn diagram showing overlap between COD genes and housekeeping genes.

