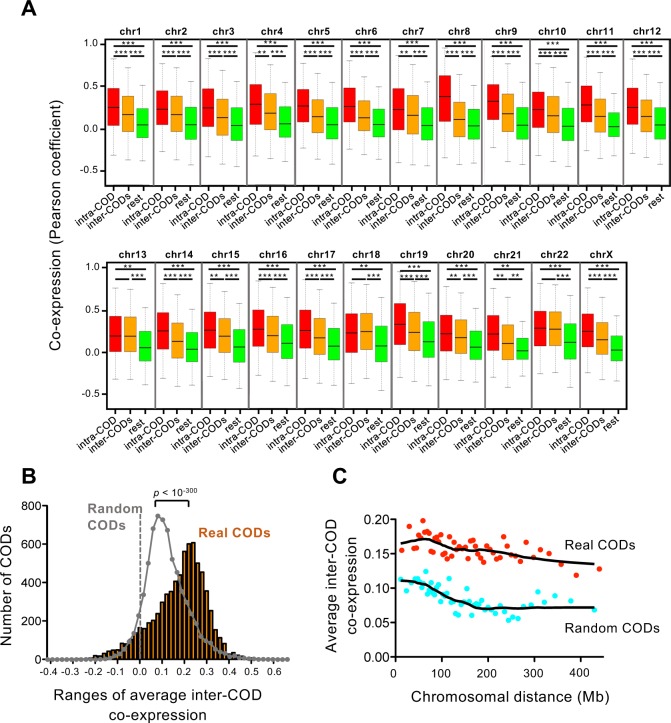
Fig 2. Characterization of inter-COD coexpression.
(A) Box plot of coexpression (Pearson correlation coefficient) of pair of genes that reside in the same COD (intra-COD), in two different CODs (inter-COD), and rest of pairwise gene coexpression (rest). *** p < 10−100; ** p < 10−10, Bonferroni-corrected p-values of the Mann-Whitney test. (B) Distribution of average inter-COD coexpression values. Distribution obtained with randomized CODs of the same size is also plotted on the grey line. Distributions are significantly different with p < 10−300 (Bonferroni-corrected Mann-Whitney test). (C) Dependence of distance between CODs of the average inter-COD coexpression. Average inter-COD coexpression data were ordered according to inter-COD distance and binned into 50 groups. Average distance and average inter-COD coexpression of each group are represented. Red dots, real CODs; blue dots, randomized CODs. Data from real CODs were significantly different respect to data from random CODs, with p < 0.01 for all bins (Mann-Whitney test).

