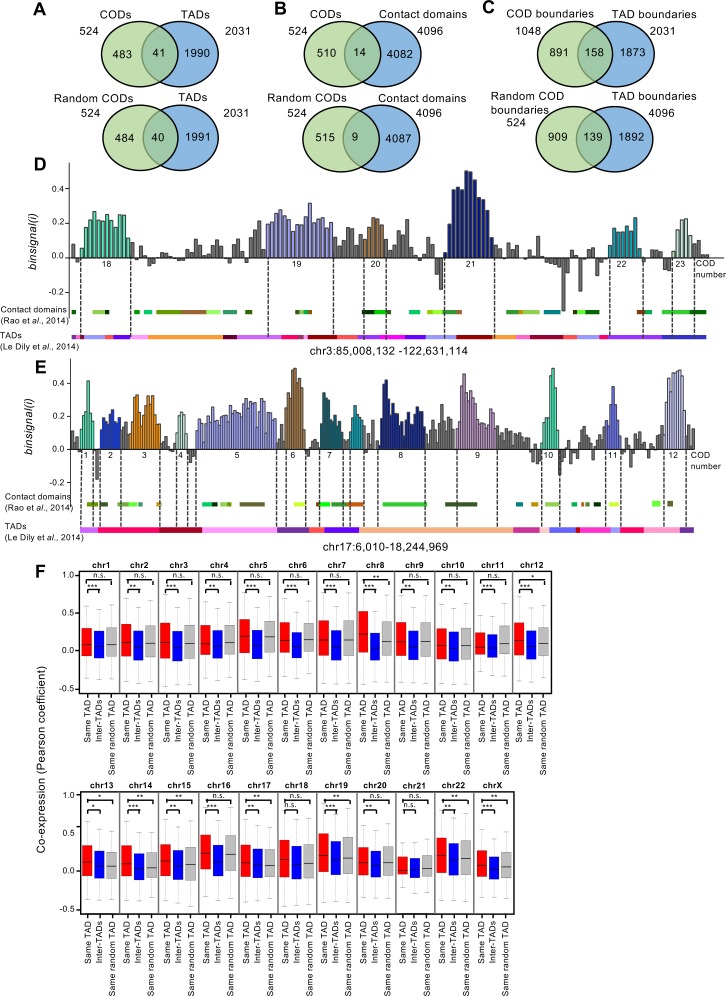
Fig 4. CODs do not correspond to TADs.
(A, B) Venn diagrams showing number of real CODs (upper panels) and randomized CODs (lower panels) that match (by at least 80% of the COD length) with TADs in the T47D cell line, as defined by [43] (A), and with contact domains of HMEC cells as defined by [37] (B). (C) Venn diagrams showing overlapping of real COD boundaries (upper panels) and randomized COD boundaries (lower panels) with TAD boundaries. (D, E) Binsignal(i) profiles of regions from chromosomes 3 (D) and 17 (E). Genes are arranged in the chromosomal order. Different CODs are depicted in different colors, and numbers correspond to the list in S1 Table. TADs from T47D (as defined by [43]) and contact domains of HMEC cells (as defined by [37]) are represented below each profile. (F) Box plot showing coexpression (Pearson correlation coefficient) of pairs of genes located within the same TAD, in different TADs (inter-TAD), or within randomized TADs of the same size. Bonferroni-corrected p-values from the Mann-Whitney test are provided.

