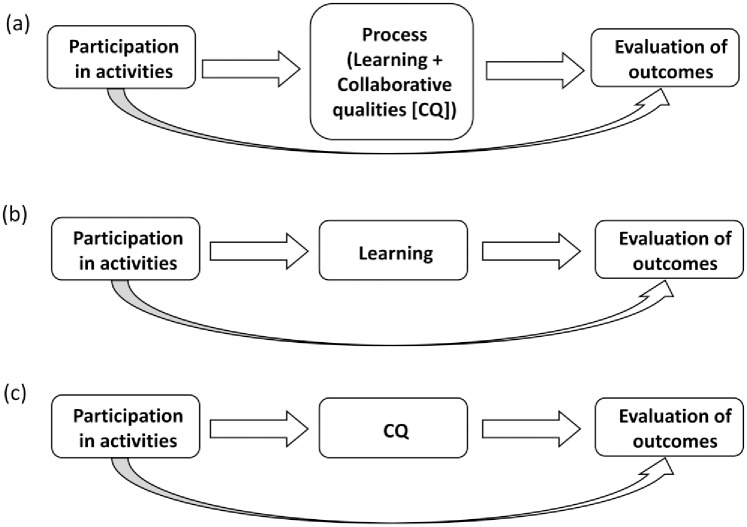
Fig 1. Three models used in the analysis.
The first model (a) test the effect of the process generally (model 1). The process variable is then unpacked and model 2 corresponds to (b), testing the effect of learning and model 3 corresponds to (c), testing the effect of collaborative qualities. Straight arrows represent indirect effects between activities and outcomes, while curved arrows represent direct effects between them.

