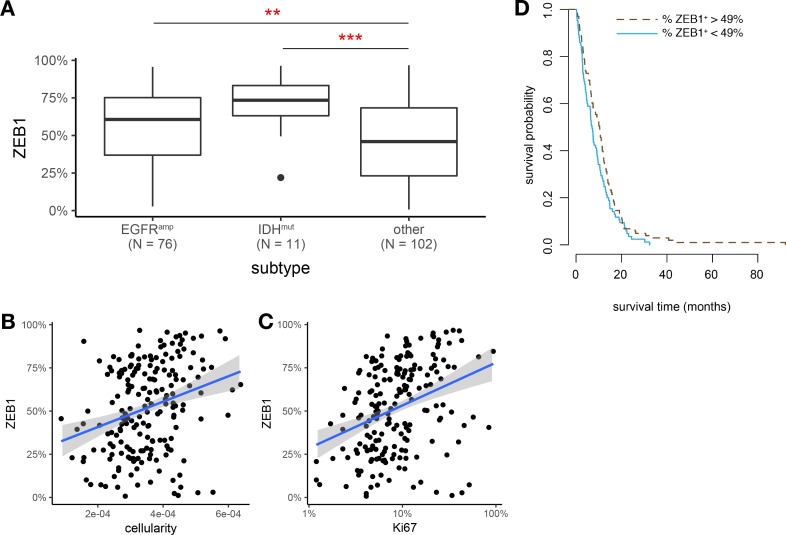
Fig 2. Intertumoral heterogeneity of ZEB1 expression.
(A) Box plots of ZEB1 labelling index (percent) with respect to EGFR amplification and IDH1 mutation. (B,C) Correlation of ZEB1 expression and Ki67 labelling index or cellularity, respectively, in N = 193 glioblastoma TMA samples. Trend lines indicate linear regression estimates. Note log scale for Ki67 index. (D) Kaplan-Meier estimates of overall survival time (months) with respect to ZEB1 expression. The observed data range of ZEB1+ percentages was split into two equally sized bins at the threshold value of 49%.

