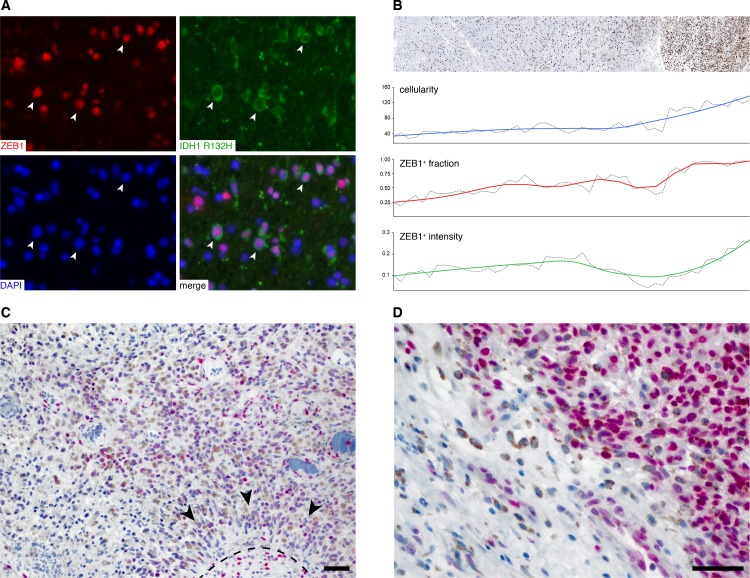
Fig 3. Intratumoral heterogeneity of ZEB1 expression.
(A) Co-labeling of IDH1 R132H and ZEB1 in a case of IDH1 mutant glioblastoma. The image shown has been taken from one out of ten fields of view that were subjected to separate and blinded manual scoring of mutant IDH1 and ZEB1 expression. (B) ZEB1 gradient along the tumor edge of a mesenchymal GBM (BLN-7 parental tumor). ZEB1 IHC, overall cellularity (blue), the relative frequency of ZEB1+ cells (red) and the mean nuclear intensity of ZEB1+ cells (green) at the tumor edge are shown. (C,D) Expression of ZEB1 (pink) and CD68 (brown) in perinecrotic regions with (C) or without (D) pseudopalisades.

