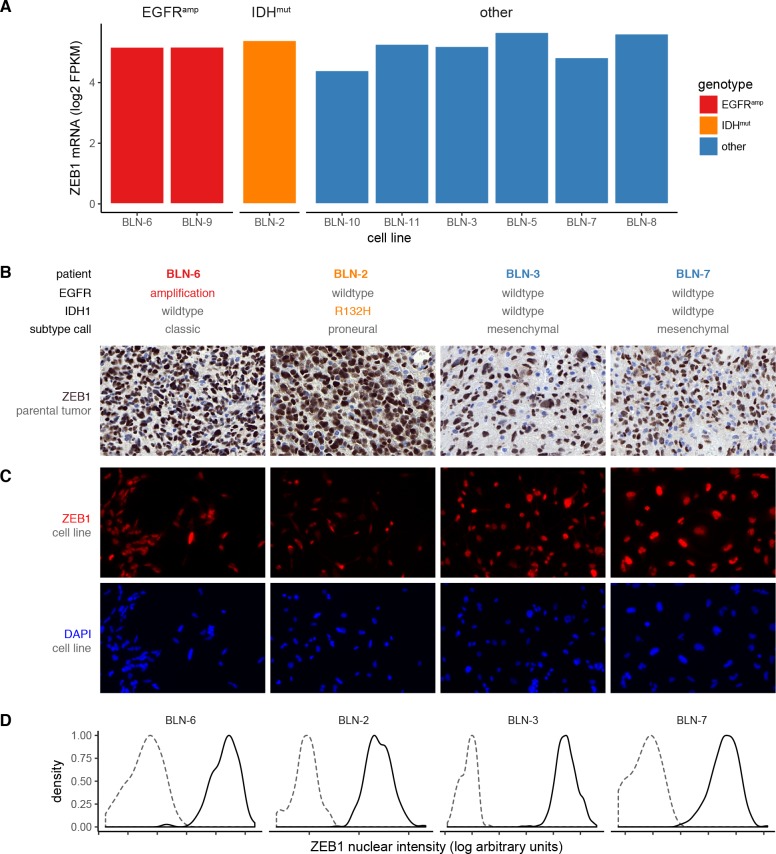
Fig 4. Expression of ZEB1 in glioma stem cell lines.
(A) ZEB1 mRNA expression in gliomasphere cell lines with known EGFR and IDH1 status of the parental tumor and cell line. Expression levels from RNA-seq are given as log2-transformed fragments per kilobase per million reads (RPKM). (B,C,D) ZEB1 protein expression in cell lines and matched parental tumors. Human GBMs (B) and matched glioma stem cell lines (C) were stained for ZEB1 using immunostaining. (D) The fraction of ZEB1-positive cells was quantified using image cytometry. Gating was performed with respect to a secondary antibody only negative control. Histograms show a representative intensity distribution of the negative control (dashed) and ZEB1 staining (solid) from at least three independent experiments.

