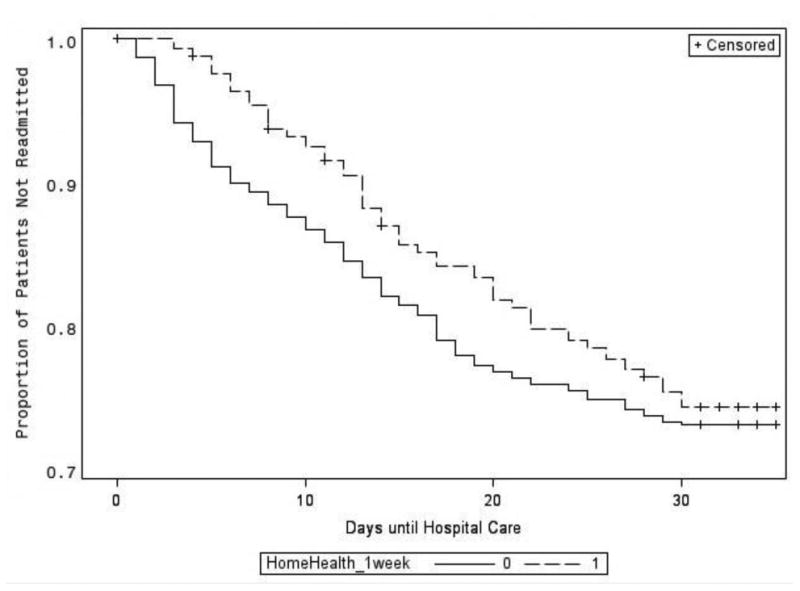
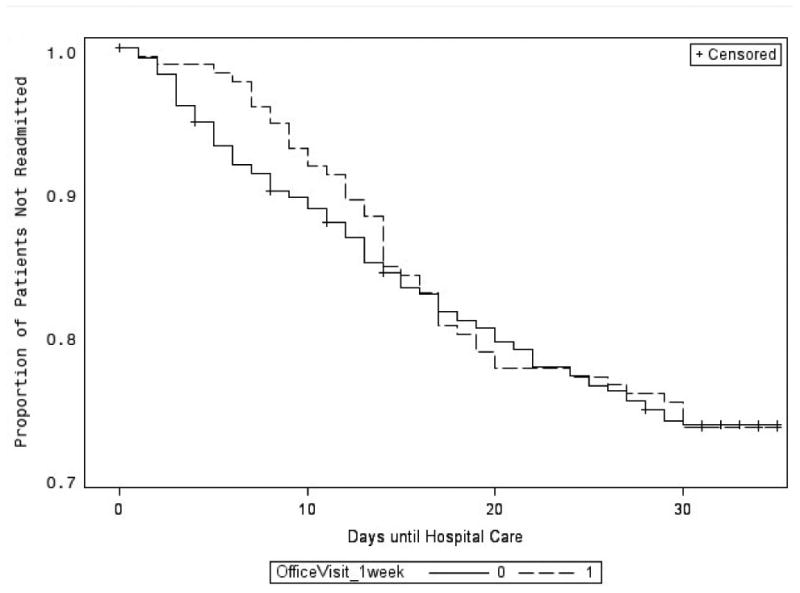
Figure 3. Product limit estimator graphs.


3A.: Hospital readmissions for those who had home health within a week versus those who did not.
Wilcoxon p-value for equality across state: p<0.001
3B.: Hospital readmissions for those who had outpatient visits within a week versus those who did not.
Wilcoxon p-value for equality across state: p=0.252
