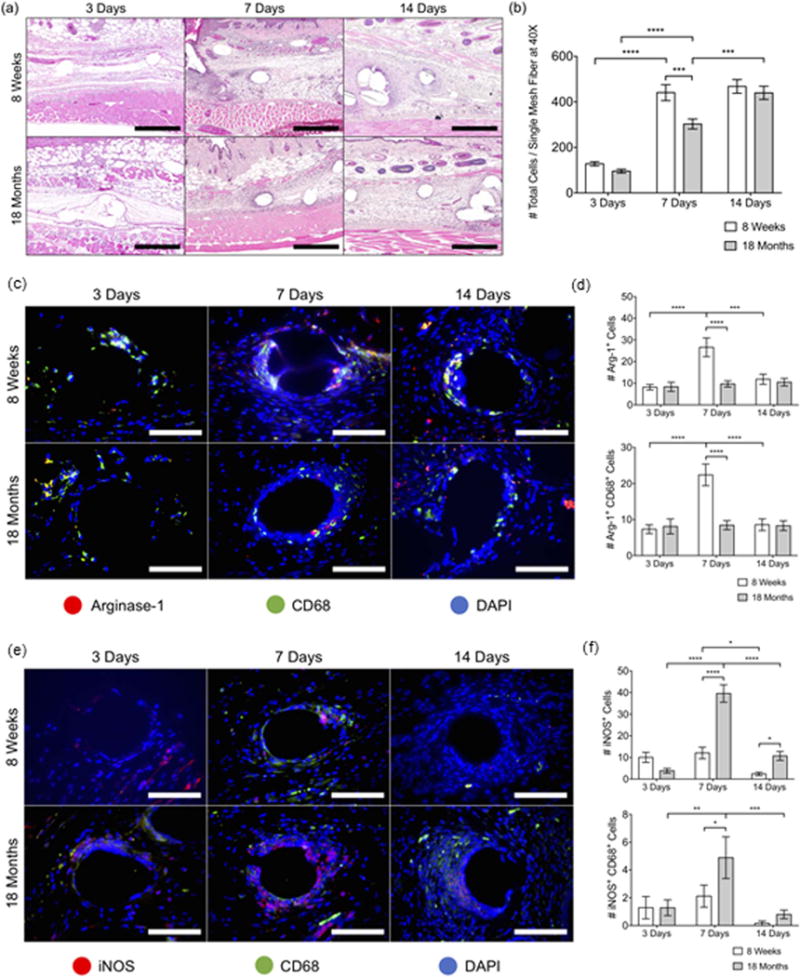
Fig. 2.

The early host response to implanted materials in young and aged C57BL/6 mice. (a) Images of H & E-stained tissue cross-sections at 10× and (b) total cell counts (DAPI) surrounding single mesh fibers in 40× images at 3, 7, and 14 days. Scale bars represent 200 mm. Fluorescence microscopy images of (c) Arginase-1 (red) CD68 (green) co-immunolabeling and (e) iNOS (red) CD68 (green) coimmunolabeling at a single mesh fiber at 3, 7, and 14 days. DAPI was used to stain cell nuclei. Scale bars represent 50 mm. Cell count image analysis of (d) Arg- 1+, Arg-1+ CD68+ cells and (f) iNOS+, iNOS+ CD68+ cells at 3, 7, and 14 days. Bars represent the mean ± SEM. Statistical significance as (*) p < 0.05, (**) p < 0.01, (***) p < 0.001, (****) p < 0.0001. All other differences are nonsignificant. N = 7.
