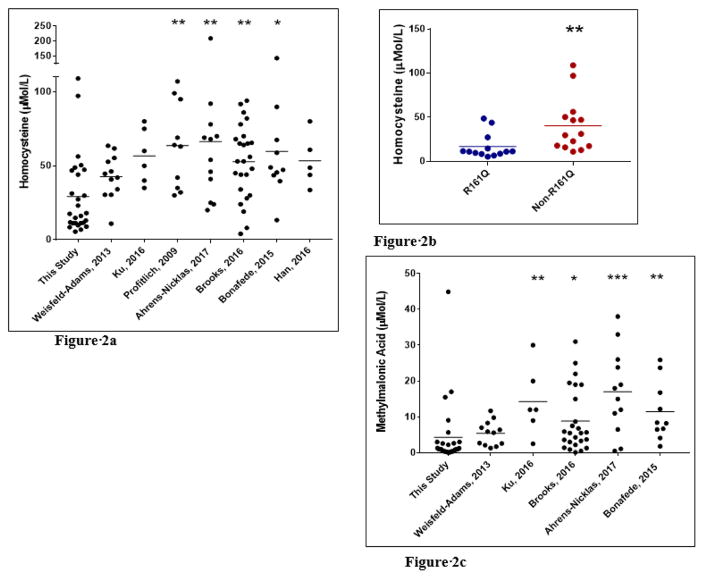
Figure 2. Comparison of Homocysteine and Methylmalonic Acid (MMA) Levels Between Patient Cohorts.
(A) Total plasma homocysteine levels in individuals with cobalamin C disease from this study compared to several large published studies is shown, demonstrating lower mean level in this report. (B) Total plasma homocysteine levels in individuals from this cohort with or without c.482G>A (p.Arg161Gln) pathogenic variant is shown, demonstrating that individuals harboring this pathogenic variant exhibit lower mean level. (C) Mean methylmalonic acid levels are lower in this study compared to published studies whereas methionine levels are comparable (not shown). * p<0.05, **p<0.01, ***p<0.001.

