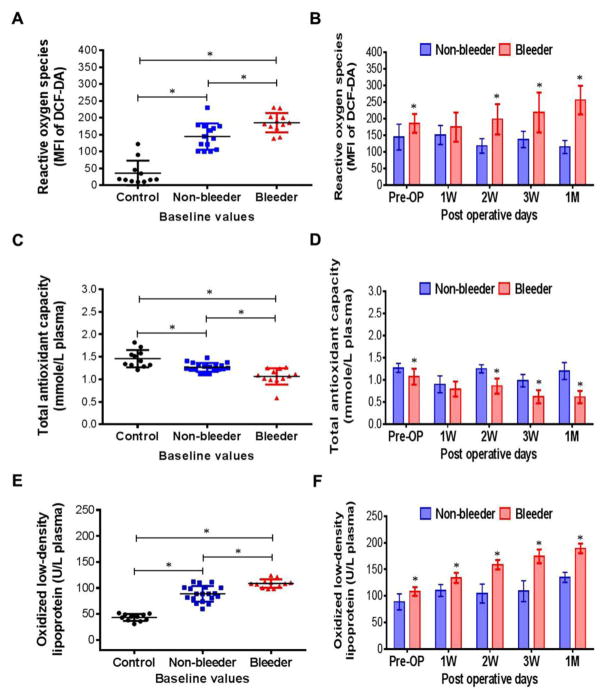
Figure 3.
Scatter plots and histograms indicating change in reactive oxygen species generation in platelets (A,B), total antioxidant capacity (C, D) and oxidized low-density lipoproteins (E, F) among controls, non-bleeders and bleeders at baseline and multiple time frames after CF-LVAD implantation. *p<0.05 is considered significant between two groups in Student’s t-test. When necessary, differences between means were further analyzed using the Tukey–Kramer HSD test. Least square mean±SD were obtained from statistical models and used in all graphical illustrations.

