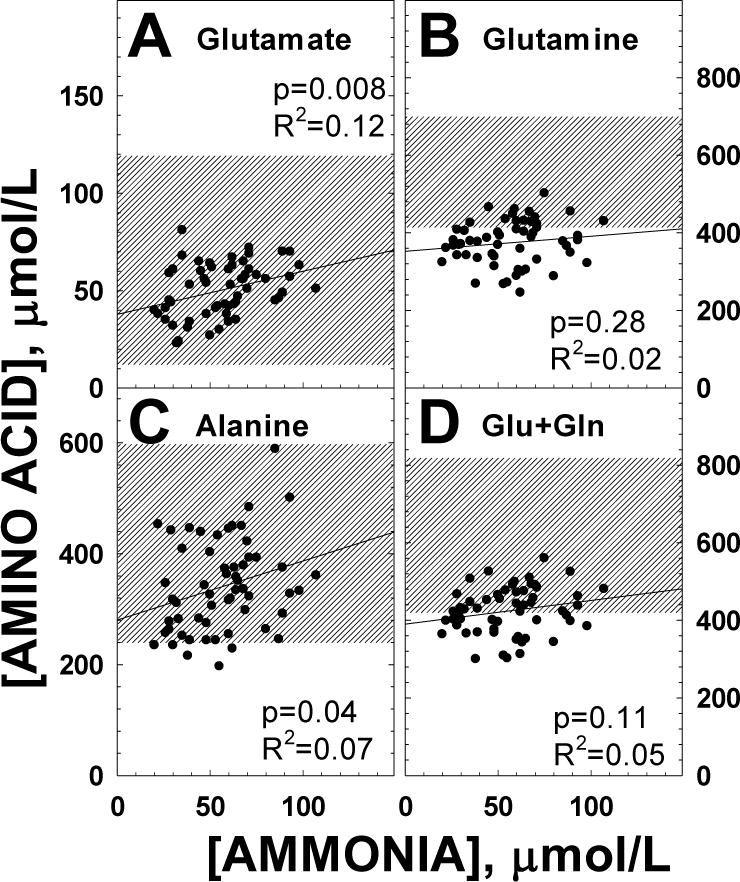
Figure 4. Correlation of ammonia levels with selected plasma amino acids in patients with propionic acidemia.

Correlation of ammonia levels with select plasma amino acids in patients with propionic acidemia during the clinical trial. Data were analyzed by linear regression with results indicated in the figure. The shaded area represents the normal range of variation.
