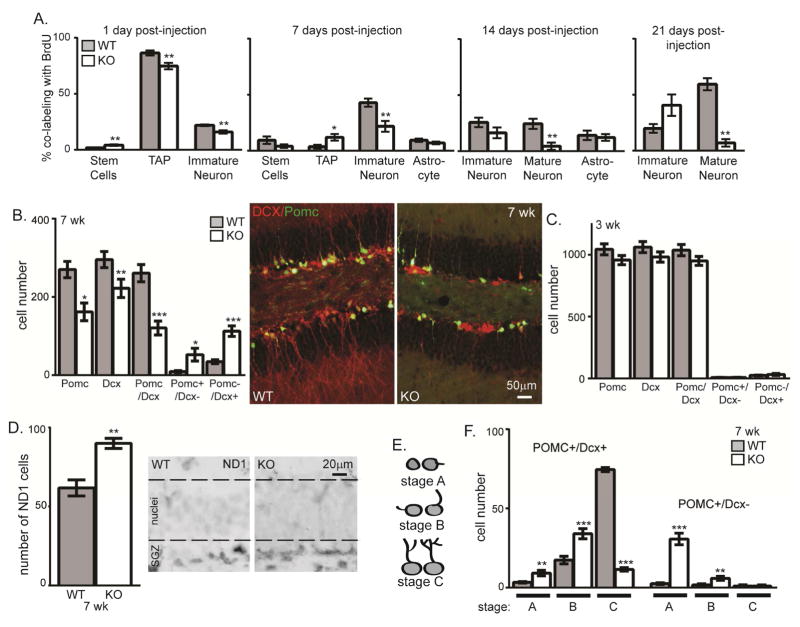
Figure 4. Klotho-deficiency impairs neuronal maturation.
A. At 3 weeks of age, WT and KO mice were injected 4x with BrdU. Brains were collected 1, 7, 14, and 21 days post-injection. IHC was performed to detect BrdU co-localization with each neurogenic cell type. The percent of BrdU containing cells that co-expressed each cell-type specific protein was quantified by averaging the total number of cells across 3 bregma levels as above. % of BrdU labeled cells also expressing BLBP (stem cell), Sox2+/BLBP- (TAP), Dcx (immature neuron), S100β (astrocytes), and NeuN (mature neurons). B. 7 week quantification of the total number of POMC+, DCX+, POMC+/DCX+, POMC+/Dcx−, or POMC−/Dcx+ cells in 3 bregma levels and KO/POMC-GFP reporter mouse representative 7 week WT and KO images (Dcx (red) and POMC (green)). DAPI not shown for clarity of neuronal arbors. Scale bars represent 50μm. C. 3 week quantification of the total number of POMC+ cells, DCX+, POMC+/DCX+, POMC+/Dcx−, or POMC−/Dcx+ cells in 3 bregma levels. D. 7 week representative images and quantification of SGZ cells expressing NeuroD1 (ND1) protein, dashed line added to delineate granule cell layer from SGZ. E. Morphology schematic used to quantify maturation stage. F. 7 week quantification of number of POMC+/DCX+ or POMC+/Dcx− cells by maturation stage. (n=6 POMC/DCX, n= 3 for ND1; mean +/− S.E.M.; T-test: *p<0.05, **p<0.007, ***p<0.0004; chi-square: A stem cells and astrocyte).

