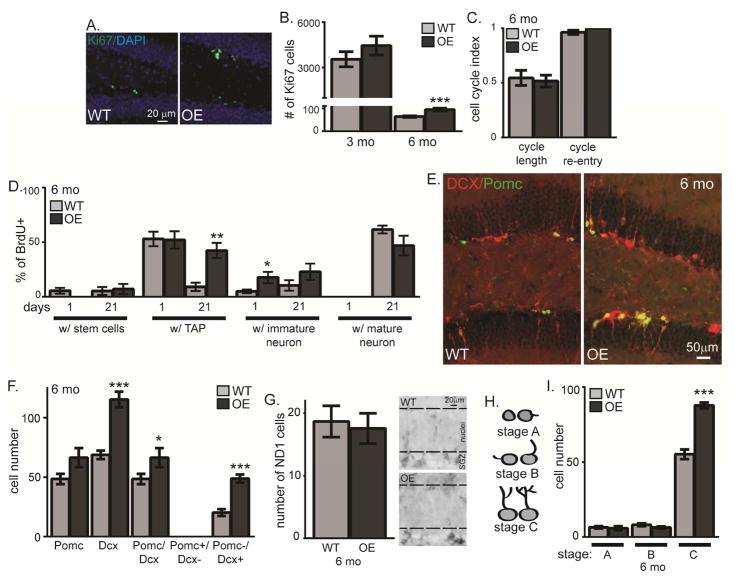
Figure 5. KL overexpression enhances neuronal maturation.
A,B. WT and OE 6 month IHC for proliferating cells (Ki67), 3 and 6 month stereological quantification. Cell nuclei labeled with DAPI. Scale bar represents 20μm. C. 6 month old mice received 1 BrdU injection to measure cell cycle length (BrdU++Ki67+/BrdU+) and cell cycle re-entry (BrdU++Ki67+/Ki67+). D. 6 month old WT and OE mice were injected 4x with BrdU. Brains were collected 1 day and 3 weeks (21 days) post-injection. The percent of BrdU cells that co-expressed each cell-type specific protein were quantified as in Figure 4: stem cells (BLBP+), TAPs (Sox2+/BLBP−), immature neurons (Dcx+), and mature neurons (NeuN+). E. OE/POMC-GFP reporter mouse representative 6 month WT and OE images (Dcx (red) and POMC (green)). DAPI not shown for clarity of neuronal arbors. Scale bars represent 50μm. F. 6 month quantification of the total number of POMC+, DCX+, POMC+/DCX+, POMC+/Dcx−, or POMC−/Dcx+ cells. G. 6 month representative images and quantification of SGZ neuroD1+ cells (ND1) with dashed line added to delineate SGZ from granule cell body layer. H. Morphology schematic used to quantify maturation stage. I. 6 month quantification of number of cells POMC+/DCX+ or POMC+/Dcx− by maturation. (n=4–6 POMC/DCX, n= 3 for ND1; mean +/− S.E.M.; T-test: *p<0.05, **p<0.007, ***p<0.0004)

