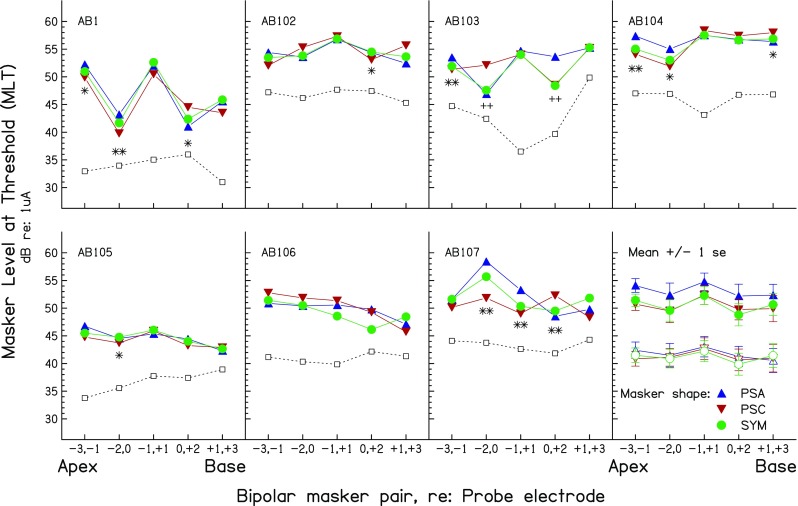
FIG. 3.

Forward-masked PTCs from experiment 1. The first seven panels show the results for individual subjects. Mean data are shown in the eighth (bottom right) panel for all subjects (filled symbols) or for all except subject AB1 (open symbols, shifted downwards by 10 dB for clarity). PTCs for the PSA, PSC, and SYM maskers are shown by the upward triangles, downward triangles, and circles, respectively. Points where the MLTs for the PSA and PSC maskers differed significantly at the 0.05 and 0.01 levels are shown by single and double symbols, respectively; asterisks indicate instances where the difference is in the predicted direction (PSA > PSC for apical maskers, PSA < PSC for basal maskers; see text) whereas crosses show differences in the opposite direction. The ordinate shows the MLT for the PTC measures. The values on the ordinate also show the detection threshold for each probe in quiet, shown by the open squares joined by dashed lines, which are shifted upwards by an arbitrary amount for each subject. These amounts are, in ascending order of subject number, −9, 0, −8, −9, −12, −3, and 0 dB.
