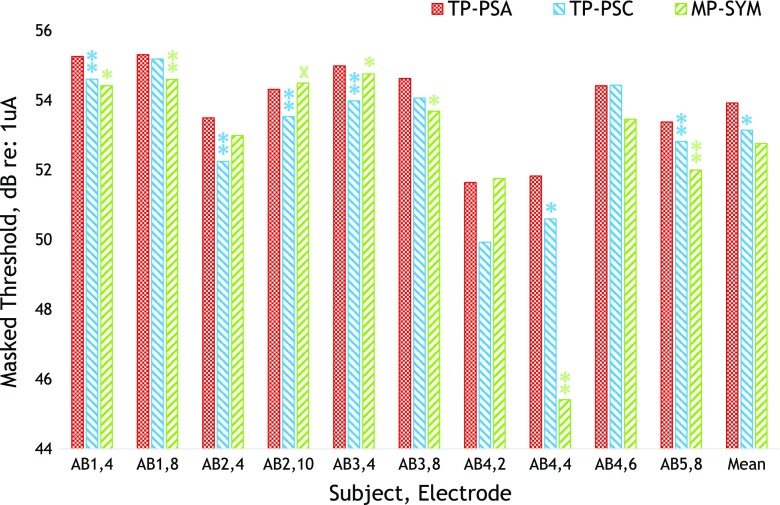
FIG. 6.
Masked thresholds for each masker type and subject/electrode combination of experiment 3. Each cluster of three bars shows the data for one subject/electrode combination, with conditions TP-PSA, TP_PSC, and MP_SYM ordered from left to right and shown in red (cross-hatch), blue (downward stripes), and green (upward stripes), respectively. Cases where the TP_PSC stimulus produced significantly more masking than either the TP_PSC or MP_SYM masker are shown by single (p < 0.05) or double (p < 0.01) asterisks, respectively. The one case where it produced significantly less masking than the MP_SYM stimulus (subject AB2, e10, p < 0.05) is shown by a cross.

