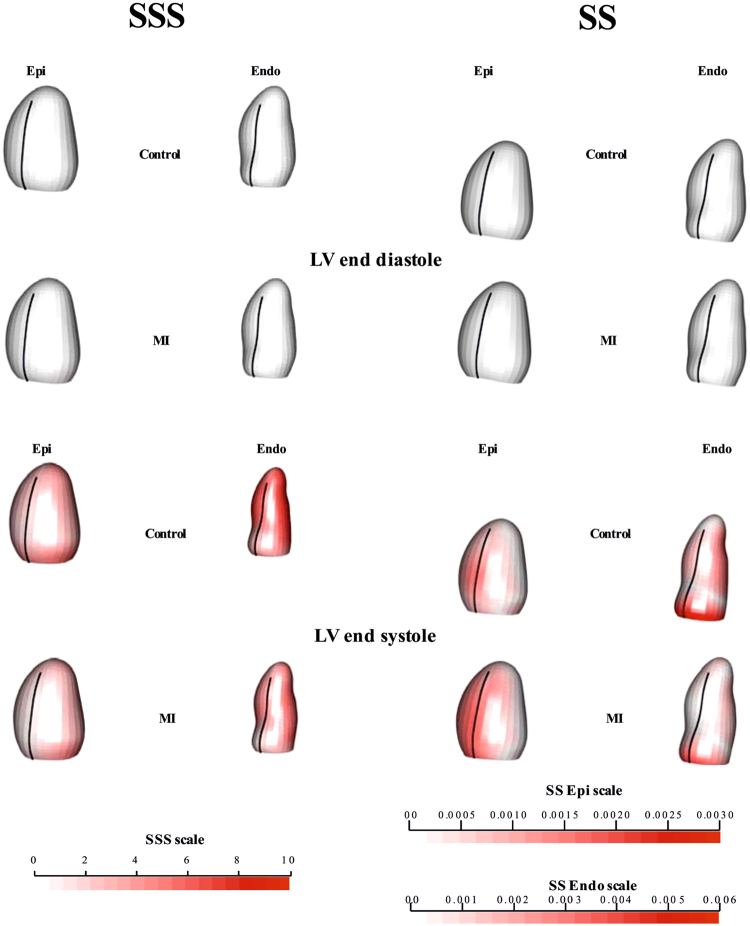
Figure 1.
Mean shapes occurring at end-diastole and end-systole after Parallel Transport (PT). Colors in end- systole refer to the difference from end-diastolic state (that is white = undeformed, red = deformed). The colormap ranges from white (=no deformation) to red (max) and refers to || xM-x || with xM the position at end-diastole and x its position at end-systole. As in SS the shapes are scaled to unit size and the deformations of epicardium and endocardium have different magnitudes, different color scales are used. The black line indicates the position of the inter-ventricular septum. See Supplementary Files 1 and 2 for dynamic visualizations.

