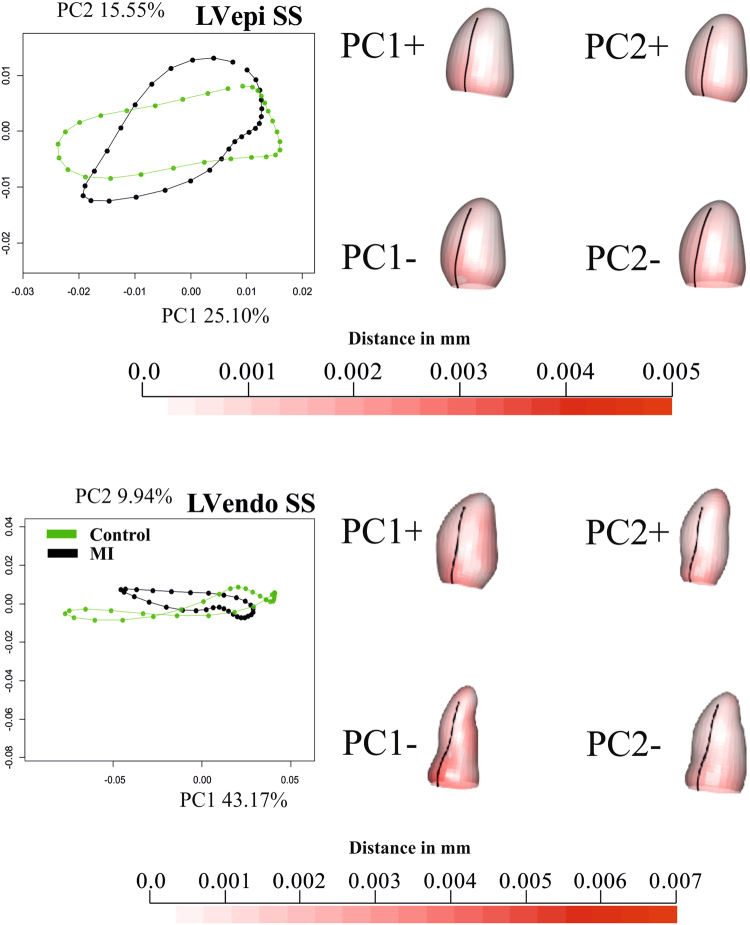
Figure 3.
Results of GPA + PT + PCA for epicardium and endocardium in SS. For visualization purposes, only one per-group mean trajectory (300 Controls vs 300 MI) is shown. The colormap ranges from white ( = no deformation) to red (max) and refers to || xM-x || with xM the position at the Grand Mean and x its position at the PC axis extreme. As in SS the shapes are scaled to unit size and the deformations of epicardium and endocardium have different magnitudes, different color scales are used. The black line indicate the position of inter-ventricular septum. The PC scores of first three PCs are used as “landmarks” in the trajectory analysis taking in to account all 600 trajectories present in the dataset. See Supplementary Files 5 and 6 for dynamic visualization of trajectories and associated shape changes. Shapes are predicted at actual positive and negative axes extremes.

