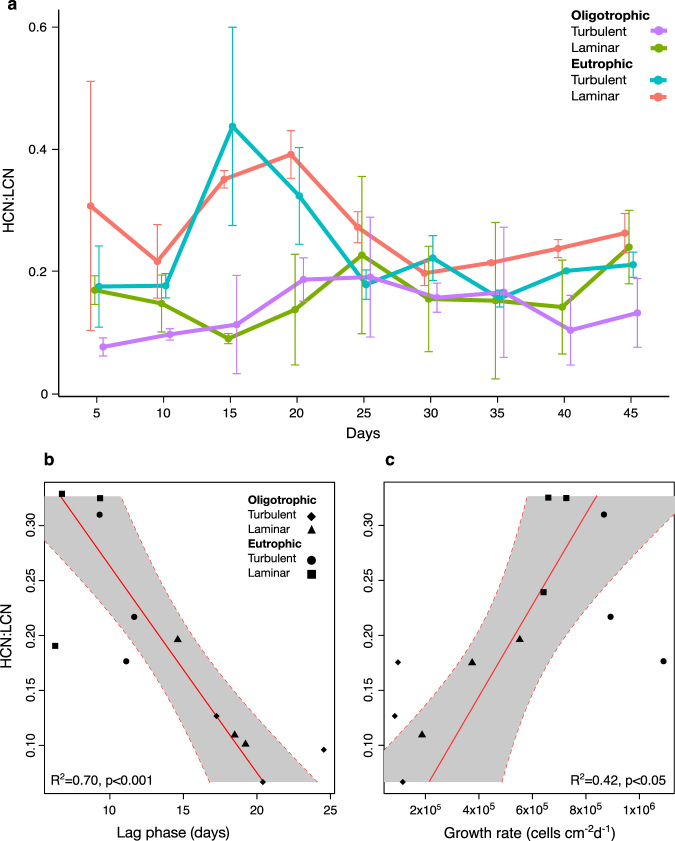
Fig. 1.
rrn copy number distribution during biofilm succession. Temporal dynamics of average rrn copy number ratio (HCN:LCN) are shown over the course of the two experiments (oligotrophic and eutrophic systems under laminar and turbulent hydraulic conditions) a. Error bars display the standard deviation (n = 3). The shaded area highlights the initial succession phase. The rrn copy number distribution (HCN:LCN) is related to bulk biofilm growth parameters such as lag phase (L) b and maximum growth rate (µ max) c. The red lines and gray shaded areas represent OLS linear regressions and 95% confidence intervals, respectively

