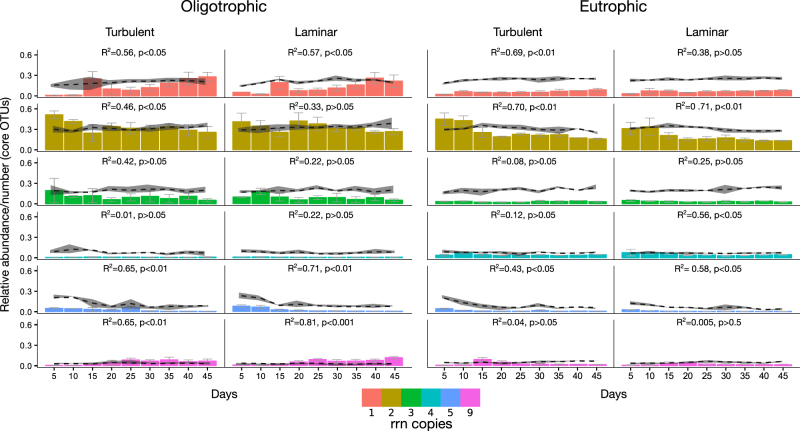
Fig. 2.
Temporal dynamics of OTUs categorized according to rrn copy number. The bars denote the average relative abundance (n = 3) of OTUs with rrn 1–5 and 9. OTUs with rrn 6–8 and >9 were rare and did not contribute to stream biofilm communities originating from oligotrophic and eutrophic water. Error bars denote the standard deviation and R 2 and p values for OLS linear regressions are shown. The dashed lines represent the relative number of OTUs with rrn 1–5 and 9 occurring at each time point. Standard deviation envelopes were calculated from n = 3 independent replicates

