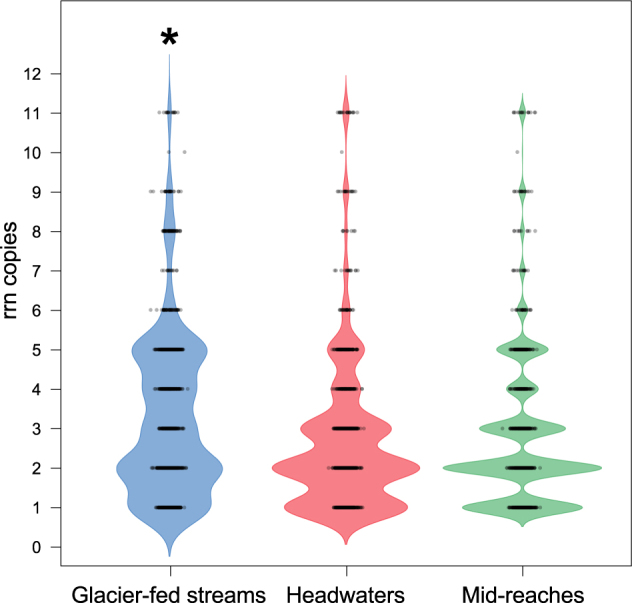
Fig. 3.

rrn copy number distribution in biofilms from different streams. The rrn probability density distributions (colored areas) of core stream biofilm OTUs (glacier-fed streams = 1825 OTUs; headwaters = 1478 OTUs; mid-reaches = 1240 OTUs) are shown. Underlying box-whisker-plots indicate the median (line), interquartile range (box) and extreme values (whiskers). Asterisks highlight significant differences in median rrn between biofilms from glacier-fed streams and subalpine streams without glacier influence (Mann–Whitney U-test, p < 0.001)
