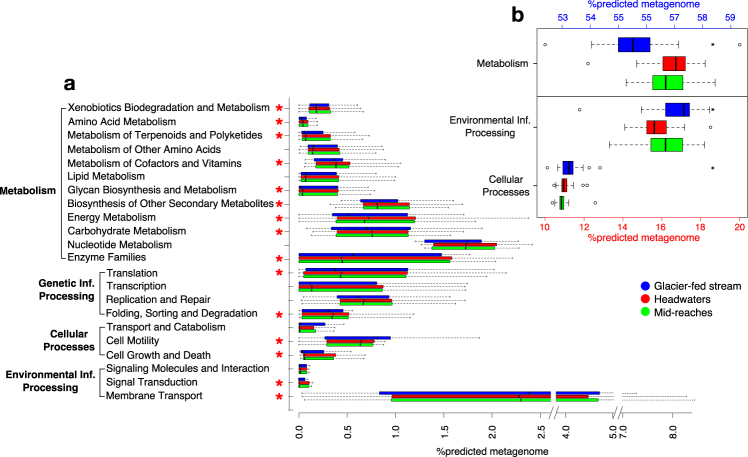
Fig. 4.
Predicted relative gene family abundances for stream biofilms in different habitats. a Boxplots displaying the relative gene counts corresponding to KEGG orthology families from category 2 of biofilms from glacier-fed streams (blue), headwaters (red) and mid-reaches (green). Asterisks (red) indicate gene categories that are significantly different (ANOVA, Tukey HSD, Bonferroni-corrected p < 0.05) between biofilms from glacier-fed streams and subalpine streams. Boxes indicate the interquartile ranges, medians are shown as lines within the boxes, whiskers display lower and upper quartiles. b Boxplots displaying the relative gene counts corresponding to the KEGG orthology families Metabolism (shown on upper y-axis, blue), Environmental Information Processing and Cellular Processes (both shown on lower y-axis, red). Boxes indicate the interquartile ranges, medians are shown as lines within the boxes, whiskers display lower and upper quartiles, outliers are shown as circles. Asterisks (black) highlight significant differences in gene counts between biofilms from glacier-fed streams and subalpine streams without glacier influence (ANOVA, Tukey HSD, p < 0.01)

