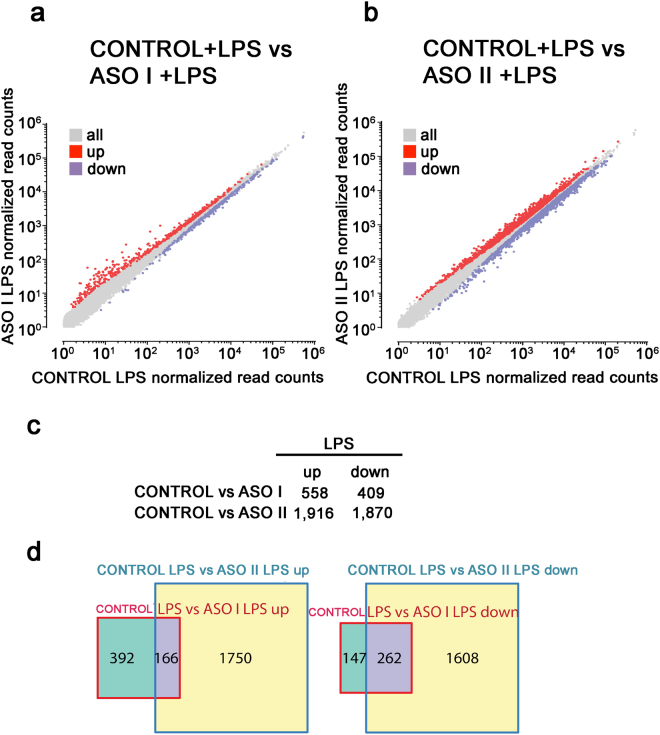
Figure 3.
Gene expression changes upon mcircRasGEF1B depletion. (a and b) Scatter plots show gene expression changes in (a) LPS-stimulated ASOI-treated cells; (b) LPS-stimulated ASO II-treated cells; relative to LPS-stimulated control cells. (c) Number of differentially expressed genes in ASOI- or ASO II-treated, and LPS-stimulated cells. (d) Overlap between differentially expressed genes in ASO I- or ASO II-treated, and LPS-stimulated cells.

