Figure 1.
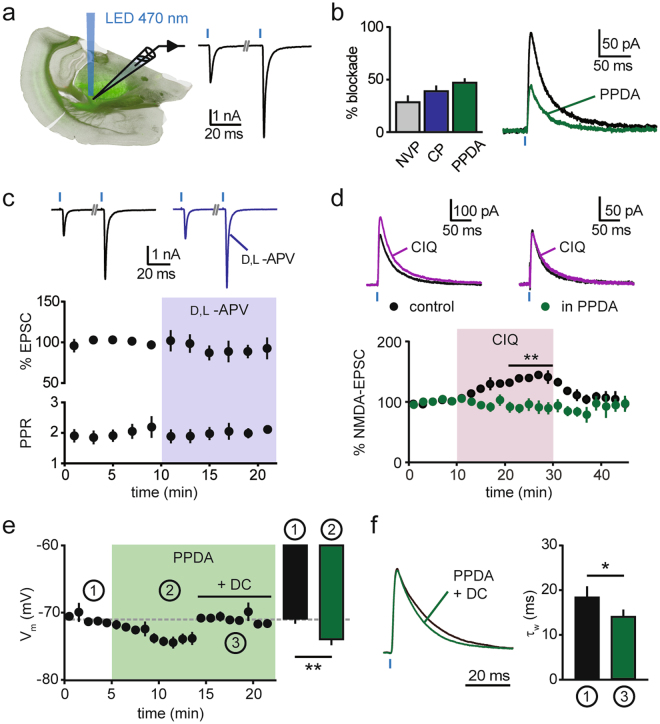
GluN2C-NMDARs at corticoreticular synapses. (a) Scheme of the experimental condition for optogenetic stimulation of corticoreticular synapses in acute slices of Ntsr1-Cretg/+ mice. Green fluorescence in the image shows ChR2-positive fibers originating from layer 6 cortical cells and invading the thalamus. On the right, example EPSCs recorded at −70 mV showing pronounced paired-pulse facilitation (50 ms inter-stimulus interval). Blue thick marks indicate LED flashes. (b) Reduction of isolated corticoreticular NMDA-EPSCs upon superfusion of the GluN2A-preferring antagonist NVP-AAM077 (NVP, 50 nM, n = 7), the GluN2B-selective blocker CP-101.606 (CP, 10 µM, n = 7) and the GluN2C/2D blocker PPDA (500 nM, n = 7). On the right, example of mean NMDA-EPSCs recorded at +40 mV before (black) and after (green) PPDA superfusion. (c) Lack of effect of NMDAR blockade (100 µM D,L-APV) on peak amplitude and paired-pulse ratio (PPR) of AMPA-EPSCs recorded at −70 mV (n = 6), with example average traces at the top, before (black) and after (violet) D,L-APV perfusion. (d) The potentiating effect of the GluN2C/2D modulator CIQ (20 µM) on corticoreticular NMDA-EPSCs (n = 6) was prevented by PPDA (n = 6). Color-coded example traces are shown at the top. (e) Time course of the membrane potential of nRt cells recorded in current-clamp mode before (1) and after (2) superfusion of PPDA (n = 9). Membrane potential was reset to baseline values (dashed line) by direct current (DC) injection (3) for comparison of decay kinetics of EPSPs (in f). Bar graph represents average values in the indicated periods. (f) Left, mean EPSPs (normalized to peak) recorded before (black) and after (green) superfusion of PPDA. The membrane potential in PPDA was reset to baseline value by DC injection (time point 3 in panel e). Right, mean values of weighted τ (τw) of EPSPs from double-exponential fit (n = 7). *p < 0.05, **p < 0.01, two-sided paired t test.

