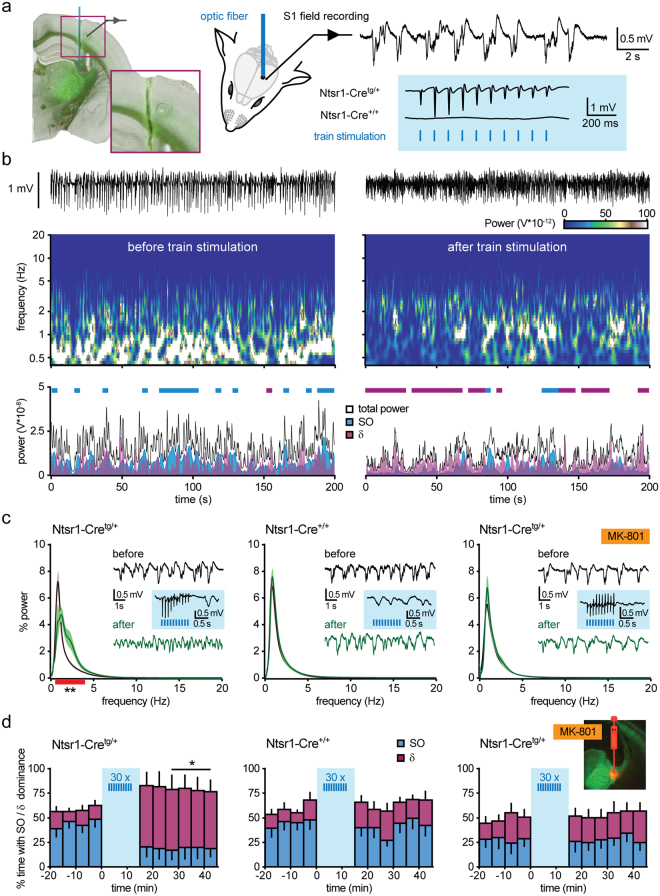
Figure 4.
NMDAR-dependent modulation of thalamocortical oscillations in vivo. (a) Left, experimental settings for in vivo optogenetic stimulation of corticoreticular fibers. Inset shows the trajectory of the optic fiber positioned on top of the nRt, and the electrocoagulation marking the position of the electrode in S1. Right, example of cortical LFPs showing low-frequency oscillations typical for urethane anaesthesia, and representative responses to laser stimulation elicited in Ntsr1-Cretg/+ mice, whereas Ntsr1-Cre+/+ mice lacked evoked responses. (b) Raw cortical LFP traces (top), power spectrum from wavelet analysis (middle) and power diagram for total power, for SOs (0.5–1.25 Hz) and δ oscillations (1.25–4 Hz) (bottom) during a 200-s long period, before and after train stimulation. Thick lines in the power diagram represent epochs in which SOs (blue) or δ oscillations (purple) were dominant, i.e. contribute to ≥ 50% of the total power. (c) Mean power spectra during baseline (black) and at 10–30 min after train stimulation (green) in Ntsr1-Cretg/+ (n = 7, left), Ntsr1-Cre+/+ (n = 5, middle), and Ntsr1-Cretg/+ mice with local injection of MK-801 (n = 6, right). Red thick line indicates the frequency range where a significant difference occurred (**p < 0.01, post hoc Fisher’s LSD test after two-way repeated measures ANOVA on 1-Hz-binned values). Representative cortical LFP stretches and photoactivated responses are displayed in the insets. (d) Time course of % dominance of SOs (blue) and δ oscillations (purple) in the three experimental series shown in (c). Fluorescence image shows verification of the injection site for MK-801 with Alexa 594. *p < 0.05, Wilcoxon test.

