Figure 5.
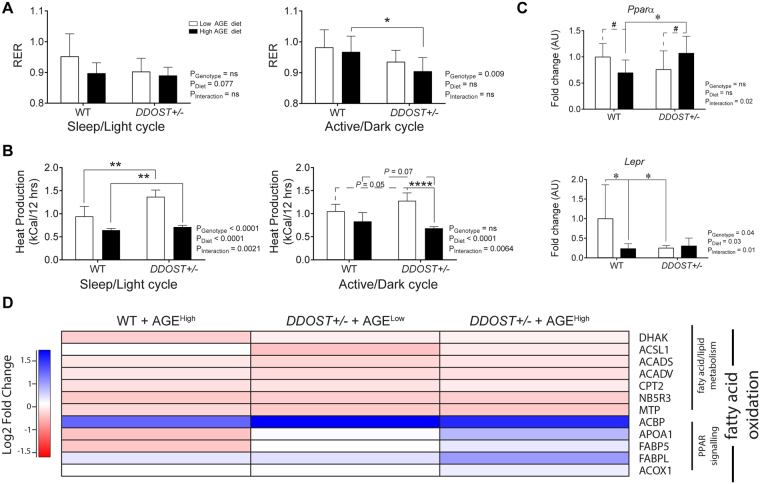
DDOST+/− mice have a shift towards increased fatty acid utilization. (A) CLAMS apparatus measured respiratory exchange rate at 24 weeks post-diet modification. Average difference in respiratory quotient corrected to lean body mass measured by indirect calorimetry during the entire 12-hour light/sleep (left) and dark/active (right) period. (B) Average difference in heat production measured by indirect calorimetry during the entire 12-hour light/sleep (left) and dark/active (right) period. (C) Real-time PCR of liver tissue targeting genes of interest Pparα (top) and Lepr (bottom) (n = 4–8 per group in triplicate). (D) Heat map representation of SWATH-MS proteomics data for enzymatic pathways involved in fatty acid oxidation. Significant proteins are represented as the Log2 fold change where red indicates a decreased and blue indicates an increase in protein concentrations. Data represented as means ± SD (n = 4–9/group). For proteomics, MSstatsV3.5.1 determined significant (P < 0.05) log fold changes in the protein intensities between the selected experimental group and the WT low AGE diet group. *P < 0.05, student’s t-test. Genotype effect P < 0.05, (diet effect) P < 0.05, 2-way ANOVA and multiple comparison of genotype, diet and interaction by Bonferroni’s post hoc test.

