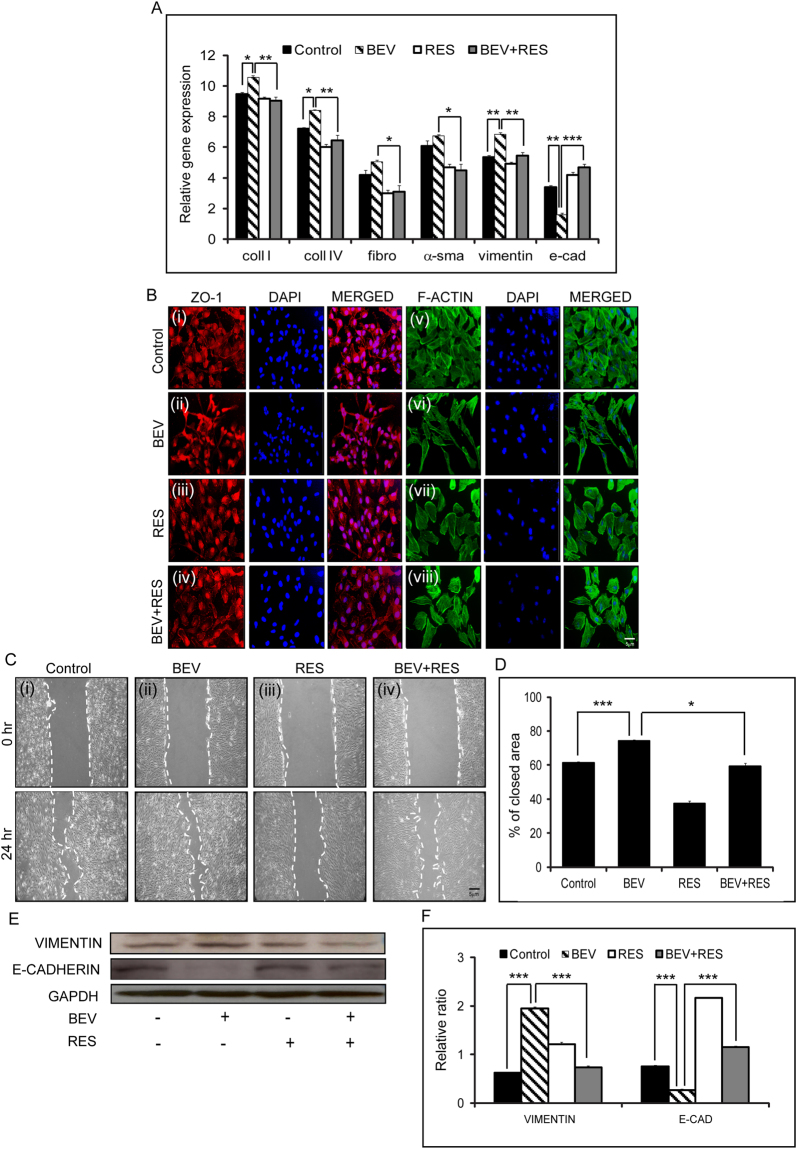
Figure-2.
Effects of BEV + RES treatment on Epithelial-Mesenchymal transition of ARPE-19 cells. Quantitative PCR results of ARPE-19 cells treated with BEV, RES, BEV + RES and untreated controls. Graphical representation of the relative mRNA levels of collagen 1 (coll 1), collagen 4 (coll 4), Fibronectin (fibro), α-smooth muscle actin (α-sma), vimentin and e-cadherin (e-cad) with respect to mRNA levels of gapdh (A). Representative immunofluorescence staining of ZO-1 (red) (i−iv), F-ACTIN phalloidin (green) (v−viii) and DAPI (blue) in cultured ARPE-19 cells with untreated controls, and treated with BEV, RES and BEV + RES. (B) Representative phase contrast microscopic images showing the scratch assay in untreated ARPE-19 cultures along with cultures treated with BEV, RES and BEV + RES at two different time points (0 hr and 24 hrs) (C). Graphical representation of the quantified closed area depicted as percentage of close area in scratch assay (D). Representative western blot analysis for the EMT markers VIMENTIN and E- CADHERIN in ARPE-19 cells exposed to BEV, RES and BEV + RES and untreated controls (E). Graphical representation of densitometric analysis of western blot quantification represented with respect to the expression levels of GAPDH (F). Statistical analysis was performed using student’s t-test (*P < 0.05,**P < 0.01, ***P < 0.005) (n ≥ 3). Scale bar = 5 µm.

