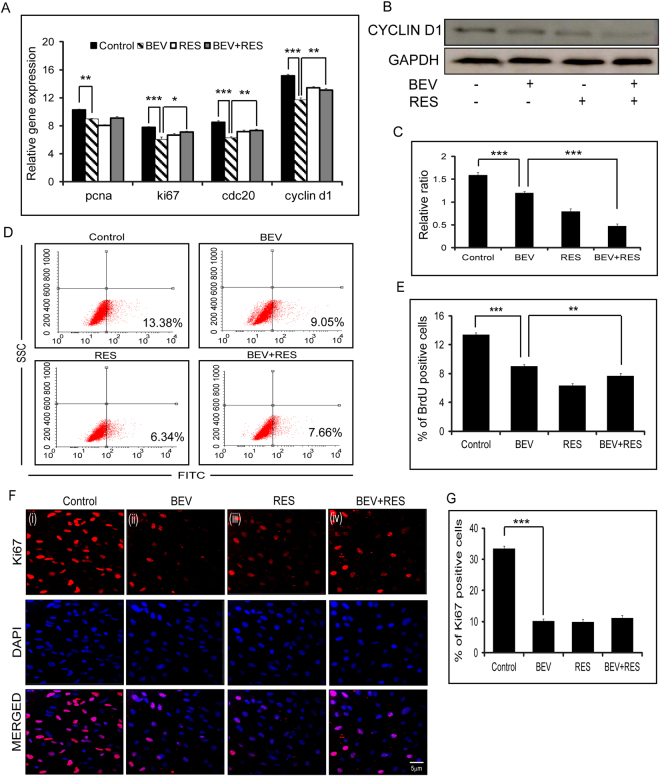
Figure-3.
Cell proliferation status of ARPE-19 cells with BEV, RES and BEV + RES treatments. Graphical representation of the levels of mRNA expression of pcna, ki67, cdc20 and cyclin d1 with respect to mRNA levels of gapdh in ARPE-19 cells treated with BEV, RES, BEV + RES and untreated controls as estimated by quantitative real-time PCR. The mRNA levels of gapdh were taken as control (A). Representative western blot results of CYCLIN D1 in untreated and treated ARPE-19 cells (B). Densitometric analysis of the expression of CYCLIN D1 with respect to the GAPDH levels is plotted graphically (C). Representative FACS plots depicting the BrdU positivity in treated and untreated ARPE-19 cells as shown in percentage of positivity (D). Graphical representation of percentage of BrdU positivity in untreated and cells treated with BEV, RES and BEV + RES (E). Representative immunofluorescence images of Ki-67 positivity (red) and DAPI (blue) in untreated cells and cells treated with BEV, RES and BEV + RES (F). Percentage of Ki-67 positivity is represented in bar graphs by counting the number of merged (red and blue) cells (G). Statistical analysis was performed using student’s t-test (*P < 0.05,**P < 0.01, P*** < 0.005) (n ≥ 3). Scale bar = 5 µm.

