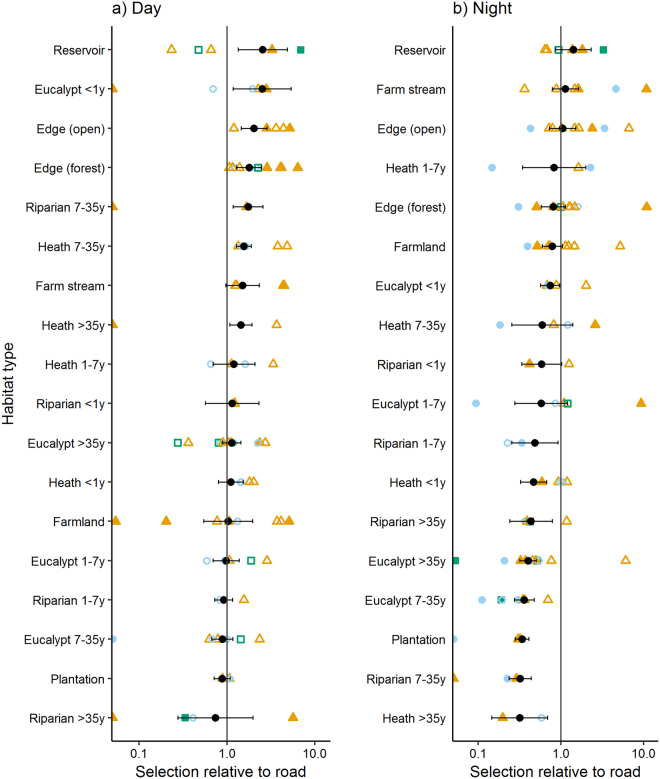
Figure 4.
Odds ratios (ORs) from step-selection function models of red fox Vulpes vulpes movements during (a) day and (b) night. An OR > 1 indicates selection for the habitat type; an OR < 1 indicates selection against the habitat type, relative to the reference habitat type (road). The population-level analysis used 60-min interval GPS data from 15 foxes in Victoria, Australia, and is shown as a black circle with 95% confidence limits. Individual analyses were also conducted if more than 30 step data were available (n = 13), and are showed as filled points if the p-value of the OR was p < 0.05, or empty points if p ≥ 0.05. Colours indicate the availability of non-forest habitats at a broad scale: ≤10% = green squares, 11–30% = blue triangles, >30% = orange diamonds. Habitats that were available to an individual (i.e. comprised ≥ 2% random samples) but were never used are indicated by a point at 0.05. The habitat urban is not presented as it was not used by foxes during the day, and always comprised <2% of available samples in the individual analyses at night. Averaged across the population, the odds ratio for urban relative to road at night was 2.5 (0.56, 11.4).

