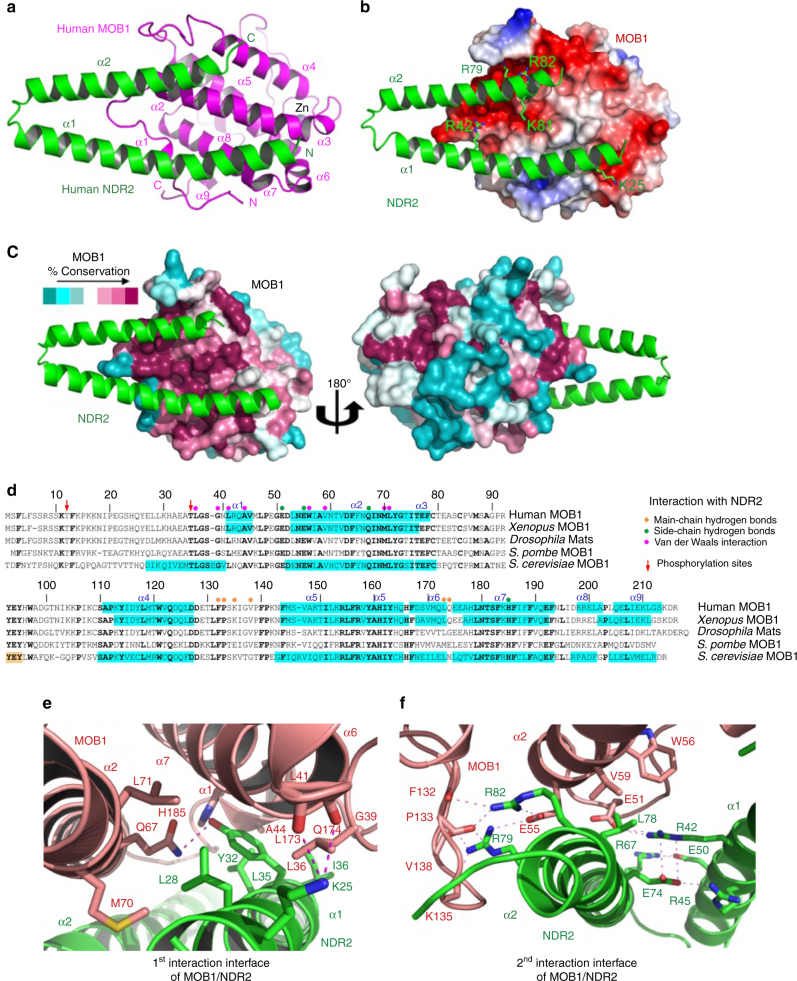
Fig. 1.
The crystal structure of the MOB1/NDR2 complex reveals phosphorylation-independent interactions of MOB1 with NDR2 through conserved interfaces. a Overall crystal structure of the complex between human MOB1A (residues 33–216) and human NDR2 (residues 25–88). MOB1 and NDR2 are colored in magenta and green, respectively. The Zinc associated with MOB1 is indicated in gray. Secondary structure elements are highlighted. b The negatively charged surface of MOB1 recognizes positively charged residues on NDR2. The electrostatic surface potential of MOB1 is shown (red: negatively charged residues; blue: positively charged residues). NDR2 is shown as a ribbon representation colored in green. c The MOB1/NDR2 binding surfaces are highly conserved. The residues of MOB1 are gradually colored according to conservation scores (dark red: most conserved residues; dark cyan: least conserved residues). NDR2 is shown as a ribbon representation colored in green. d Structure based sequence alignment of MOB1 from indicated species. MOB1 residues mediating interactions with NDR2 are marked with brown (main-chain hydrogen bonds), green (side-chain hydrogen bonds), and magenta circles (van der Waals interactions). α helices are painted with cyan background. Thr12 and Thr35 phosphorylation sites are indicated by red arrows. e, f The interaction interfaces of MOB1 with the α1 (residues 25–56) and α2 (residues 61–84) helices of NDR2. MOB1 and NDR2 and their key interacting residues are shown in pink and green, respectively. Dashed lines represent hydrogen bonds. Side-chain nitrogen, oxygen, and sulfur atoms of MOB1 and NDR2 residues are colored in blue, red and gold, respectively. The hydrogen bond network connecting the α1 and α2 helices of NDR2 is also illustrated in f. For a stereo image of a portion of the electron density map see Supplementary Fig. 18

