Figure 4.

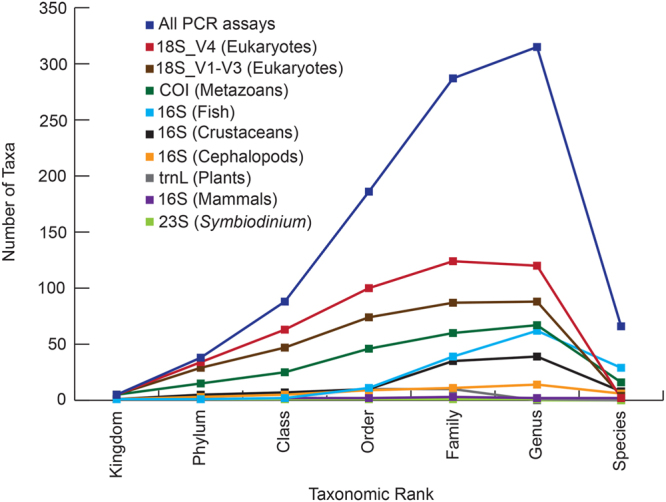
Line graph representing the number of eukaryotic taxa recorded at Coral Bay in west Australia using eDNA. Coloured lines indicate the number of taxa identified for each taxonomic rank for the nine PCR assays that target eukaryotes.

Line graph representing the number of eukaryotic taxa recorded at Coral Bay in west Australia using eDNA. Coloured lines indicate the number of taxa identified for each taxonomic rank for the nine PCR assays that target eukaryotes.