Fig. 1.

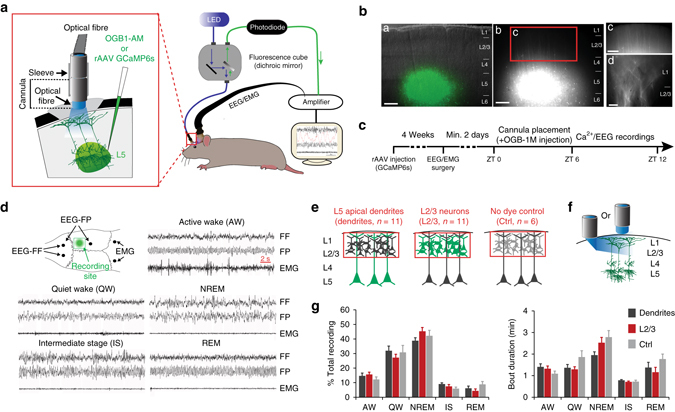
Ca2+ imaging and EEG recordings in freely behaving rats. a Schematic of combined fibre-optic Ca2+ imaging and EEG recordings. (Left) Enlarged view of the cannula attachment site. b Labelling of dendrites of L5 neurons with GCaMP6s. The injection site is shown on a 300 µm thick parasagittal slice from a rat at ~4 weeks after in vivo viral injection (a: superimposed with a brightfield image of the slice; b–d: dendrites expressing GCaMP6s at different magnifications). Layers are represented on the right. Scale bars, a–c=250 µm and d=20 µm. c Experimental design. d EEGs (fronto-frontal (FF), fronto-parietal:(FP)), EMG electrode placement and Ca2+ recording site (upper left) and representative EEG/EMG traces for all five behavioural states. e, f Schematic representations of the region imaged (red rectangle) in the three main groups (e) and the two types of illumination orientations for dendritic recordings (f). g Mean (±s.e.m.) percentage of time spent in each behavioural state (left) and state bout duration (right) did not differ between groups (two-way ANOVA; factor “group”: %: F2, 150 = 0.26, P = 0.77; duration: F2, 150 = 0.295, P = 0.055, see e for animal number/group)
