Fig. 2.
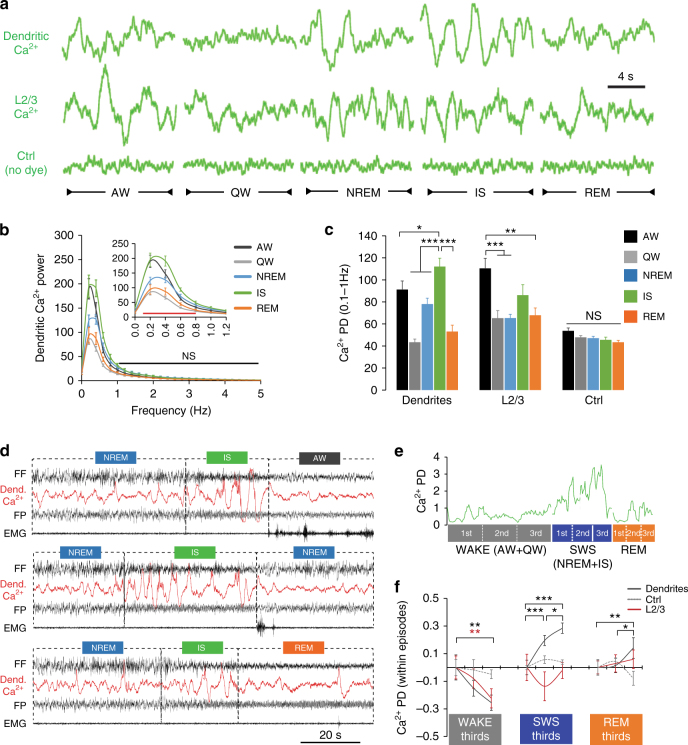
Ca2+ activity in populations of dendrites is largest at NREM transitions (IS). a Representative examples of fibre-optic signals recorded in the three groups for each behavioural state. b Mean (±s.e.m.) power spectra of the dendritic Ca2+ signal in each state (normalised to the mean across behavioural states). Significant differences between states were only found for frequencies <1 Hz (two-way ANOVA; factor “state”: F4, 1248 = 50.6, P < 0.001; red line (inset graph): P < 0.05, black line (main graph): P > 0.05, Holm–Sidak test). c Mean (±s.e.m.) power density (PD) in the 0.1–1 Hz frequency band of the fibre-optic signal in the three groups across behavioural states (factor “state”: F4, 44(dendrites) = 26.1, P < 0.001 three-way ANOVA; F4, 44(L2/3) = 7.51, P < 0.001 two-way ANOVA; F4, 20(Ctrl) = 2.67, P = 0.062 two-way ANOVA; *P < 0.05, **P < 0.01 and ***P < 0.001, Holm–Sidak test). The effects of the “dye” and “illumination” factors for dendritic and L2/3 Ca2+ activity are reported in Supplementary Fig. 3. d Examples of combined EEG/dendritic Ca2+ recordings at the IS transitions to AW, NREM and REM sleep. e Behavioural episodes analysis method (see Methods). An average PD is calculated for each third across individual episodes of WAKE (AW+QW), SWS (NREM+IS) and REM sleep. The green line represents fluctuations of dendritic Ca2+ PD. f Mean (±s.e.m.) optical signal PD changes within episode thirds. Statistical significance was tested using one-way RM ANOVA. WAKE: F2, 20(dendrites) = 6.57, F2, 20(L2/3) = 6.8, P = 0.006 for both groups; SWS: F2, 20(dendrites) = 23.76, P < 0.001; REM: F2, 16(dendrites) = 7.3, P = 0.006. *P < 0.05, **P < 0.01 and ***P < 0.001, Holm–Sidak test. N = 11 for dendrites and L2/3 groups and n = 6 for the Ctrl group

