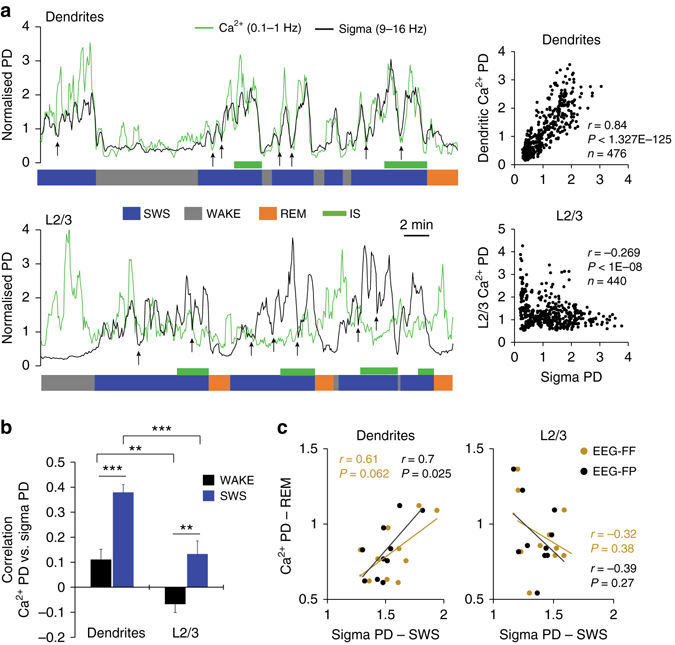
Fig. 3.

Correlation between Ca2+ activity in population of dendrites and sigma EEG power. a Example of Ca2+ and sigma PD fluctuations for an ~30 min recording segment from dendrites (upper graph) and L2/3 neurons (lower graph). Data are represented as trendlines (see Methods) and arrows point at microarousals (<5 epochs). Corresponding scatter plots are on the right (n=number of epochs, r=Pearson’s correlation coefficient). b Mean (±s.e.m.) correlation between sigma and Ca2+ activity in dendrites and L2/3 neurons across animals (n = 11/group) for WAKE (AW and QW) and SWS. Correlation with FF and FP EEGs were pooled due to similar trend (two-way ANOVA; factor “EEG”: F1, 122 = 0.06, P = 0.801; “Group”: F1, 122 = 33.26, P < 0.001). Within groups, the correlation was higher during SWS compared to wakefulness (two-way ANOVA; factor “state”: F2, 120 = 22.97, P < 0.001, **P < 0.01 and ***P < 0.001, Holm–Sidak test). c Correlation (Pearson) between sigma PD during SWS and Ca2+ PD in dendrites and L2/3 neurons during REM sleep. Values represent the average Ca2+ and EEG (FF and FP) PDs for each animal. Values from individual 4 s epochs were used for all correlations
