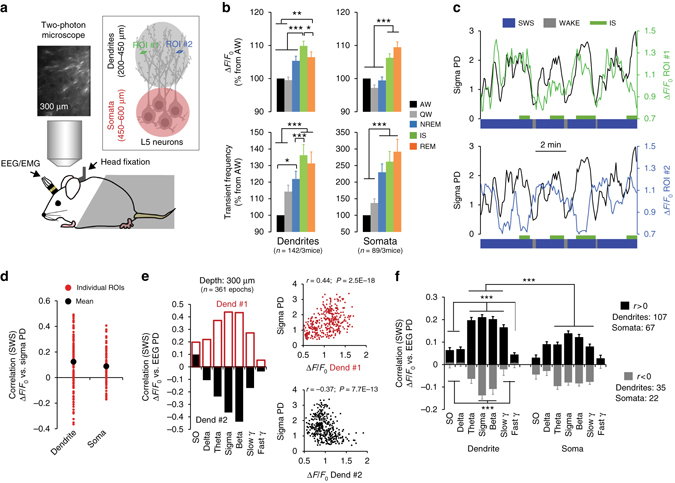
Fig. 5.

Spindle–beta oscillations correlate with increased and decreased Ca2+ activity in single dendrites. a Schematic of combined EEG recordings and two-photon Ca2+ imaging of apical dendrites and somata of L5 neurons. b Mean (±s.e.m.) Ca2+ activity (ΔF/F 0: upper graphs; transient frequency: lower graphs) across single dendrites (left graphs, n = 143 dendrites in 3 mice) and single somata (right graphs, n = 89 somata in 3 mice) for each behavioural state. Activity in individual dendrites and somata are expressed as percentage of change from respective activity during AW (one-way RM ANOVA; Dendrites: F4, 722 = 25.32; Somata: F4, 307 = 22.79; P < 0.001 for both groups, *P < 0.05, **P < 0.001 and ***P < 0.01, Holm–Sidak test). c Examples of Ca2+ ΔF/F 0 fluctuations in regions of interest (ROIs) from two dendrites imaged simultaneously (depth: −200 µm, schematised in (a)) and sigma PD. Note the reverse correlation trend. d Correlation (Pearson) between ΔF/F 0 for all single dendrites and somata and sigma PD during SWS. e Example of correlation (Pearson) coefficient between ΔF/F 0 and frequency bands (EEG-FP) for two individual dendrites recorded simultaneously at −300 µm below the pia (n = number of SWS epochs used for correlation). Corresponding scatter plots for sigma PD is shown on the right. f Mean (±s.e.m.) correlation across dendrites and somata selected to have a positive (r > 0) or negative (r < 0) correlation with sigma PD. Dendrites show a stronger correlation with EEG changes compared to somata, especially for positive correlations (two-way ANOVA; factor “group”: r > 0: F1, 1218 = 59.71, P < 0.001; r < 0: F1, 371 = 1.56, P = 0.21; ***P < 0.001, Holm–Sidak test). Within groups, increase and decrease of Ca2+ activity in single dendrites correlated with frequency bands surrounding the sigma band (two-way ANOVA; factor “frequency”: r > 0: F6, 1218 = 36.93, P < 0.001; r < 0: F6, 371 = 8.16, P < 0.001; ***P < 0.001, Holm–Sidak test). Values from individual 4 s SWS epochs were used for all correlations
