Fig. 6.

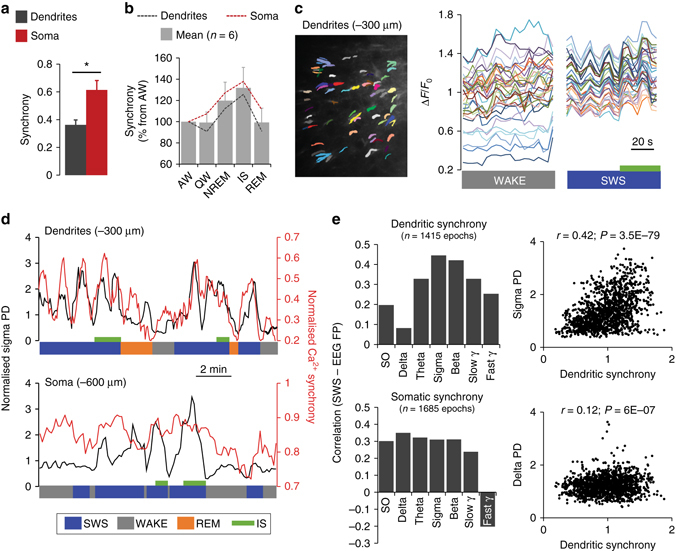
Spindle–beta oscillations reflect increased dendritic Ca2+ activity synchronisation. a Average Ca2+ activity synchronisation in dendrites and somata across all behavioural states (H = 7.1, P = 0.008 Kruskal–Wallis one-way ANOVA on ranks; *P < 0.05, Dunn’s test). N = 15/group (5 states/mice, 3 mice/group). b Synchronisation of Ca2+ activity in dendrites and somata of L5 neurons across behavioural states (expressed as percentage of respective AW value for each animal, n = 11/group). For a, b, values represent means±s.e.m. c Example of synchronisation of Ca2+ activity (ΔF/F 0) of the same 34 dendrites (imaged at −300 µm) during SWS compared to WAKE. IS is represented by the green bar. d Examples of changes in sigma PD and Ca2+ activity synchronisation for recordings from dendrites of L5 neurons (upper graph) and L5 somata (lower graph). e Correlation (Pearson) coefficient between dendritic (upper graph) and somatic (lower graph) synchrony of Ca2+ activity and different frequency bands (EEG-FP). N=number of SWS epochs used for correlations (values from the three animals in each group were pooled). Corresponding scatter plot for dendritic synchrony and sigma and delta band are represented. For c–e, values from individual 4 s SWS epochs were used for correlations
